
Report Overview
- Understand the latest market trends and future growth opportunities for the Heat Exchangers industry globally with research from the Global Industry Reports team of in-country analysts – experts by industry and geographic specialization.
- Key trends are clearly and succinctly summarized alongside the most current research data available. Understand and assess competitive threats and plan corporate strategy with our qualitative analysis, insight, and confident growth projections.
- The report will cover the overall analysis and insights in relation to the size and growth rate of the “Heat Exchangers Market” by various segments at a global and regional level for the 2010-2030 period, with 2010-2021 as historical data, 2022 as a base year, 2023 as an estimated year and 2023-2030 as forecast period.
Description:
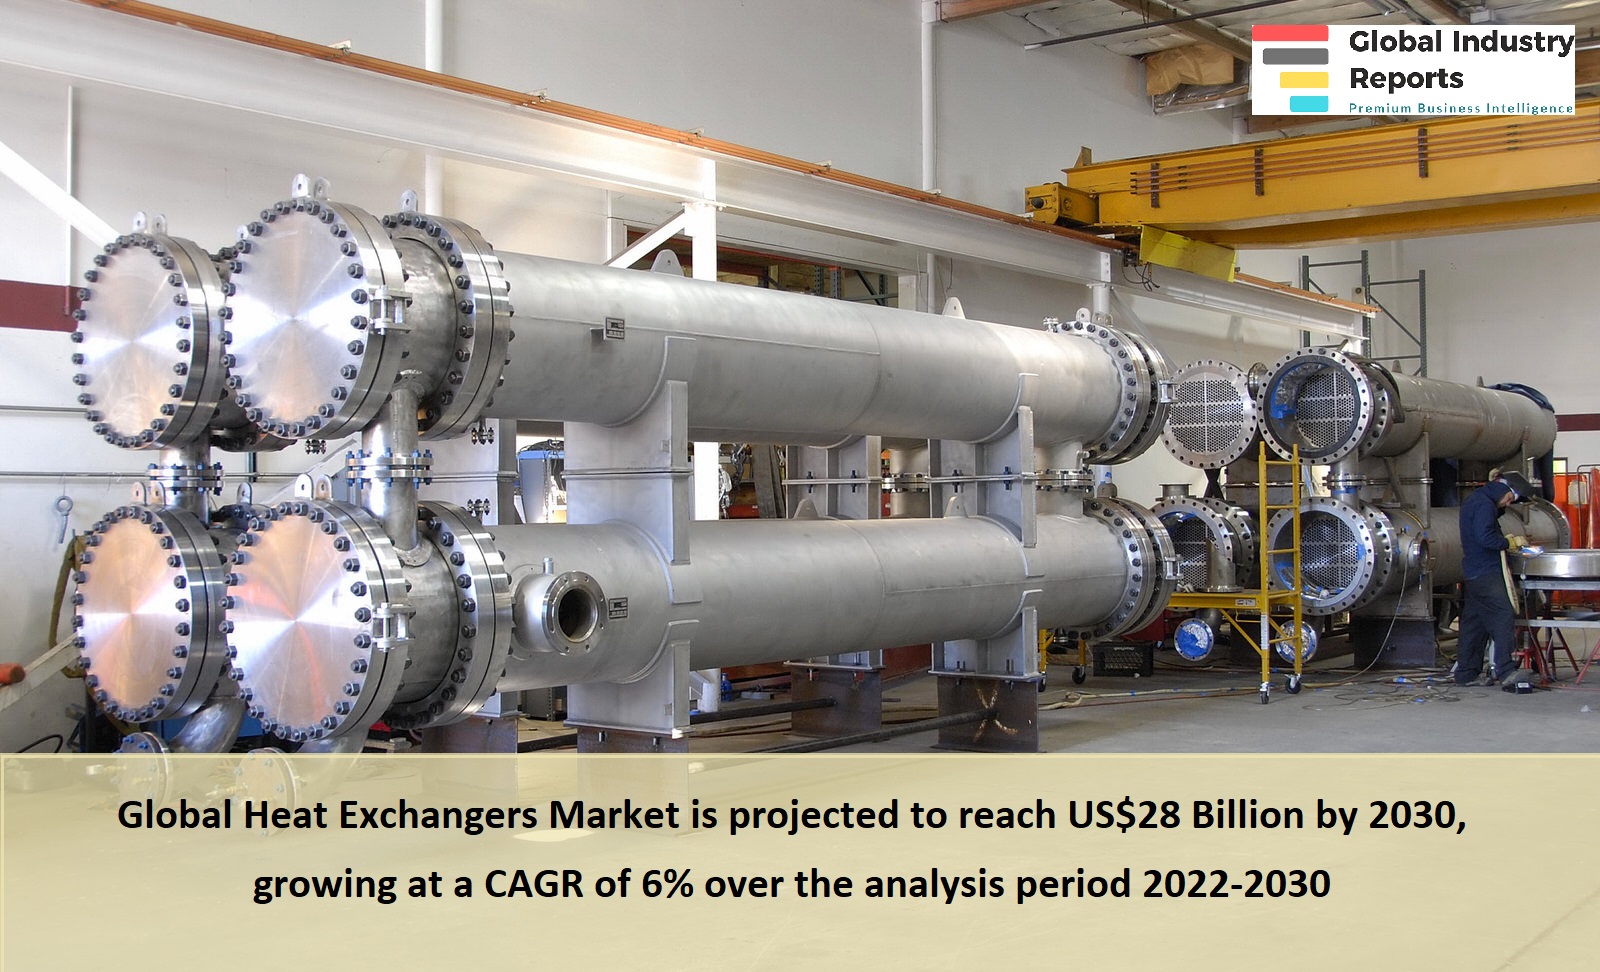
- In the changed post COVID-19 business landscape, the global market for Heat Exchangers estimated at US$17.5 Billion in the year 2022, is projected to reach a revised size of US$28 Billion by 2030, growing at a CAGR of 6% over the analysis period 2022-2030.
- Shell & Tube Heat Exchangers, one of the segments analyzed in the report, is projected to record a 4.9% CAGR and reach US$6.5 Billion by the end of the analysis period. Taking into account the ongoing post pandemic recovery, growth in the Cooling Towers segment is readjusted to a revised 6.2% CAGR for the next 8-year period.
- The Heat Exchangers market in the U.S. is estimated at US$3.9 Billion in the year 2022. China, the world`s second largest economy, is forecast to reach a projected market size of US$5 Billion by the year 2030 trailing a CAGR of 7.9% over the analysis period 2022 to 2030. Among the other noteworthy geographic markets are Japan and Canada, each forecast to grow at 4.2% and 5.1% respectively over the 2022-2030 period. Within Europe, Germany is forecast to grow at approximately 5% CAGR.
MARKET DATA INCLUDED
- Unit Sales, Average Selling Prices, Market Size & Growth Trends
- COVID-19 Impact and Global Recession Analysis
- Analysis of US inflation reduction act 2022
- Global competitiveness and key competitor percentage market shares
- Market presence across multiple geographies – Strong/Active/Niche/Trivial
- Online interactive peer-to-peer collaborative bespoke updates
- Market Drivers & Limiters
- Market Forecasts Until 2028, and Historical Data to 2015
- Recent Mergers & Acquisitions
- Company Profiles and Product Portfolios
- Leading Competitors
The Report Includes:
- The report provides a deep dive into details of the industry including definitions, classifications, and industry chain structure.
- Analysis of key supply-side and demand trends.
- Detailed segmentation of international and local products.
- Historic volume and value sizes, company, and brand market shares.
- Five-year forecasts of market trends and market growth.
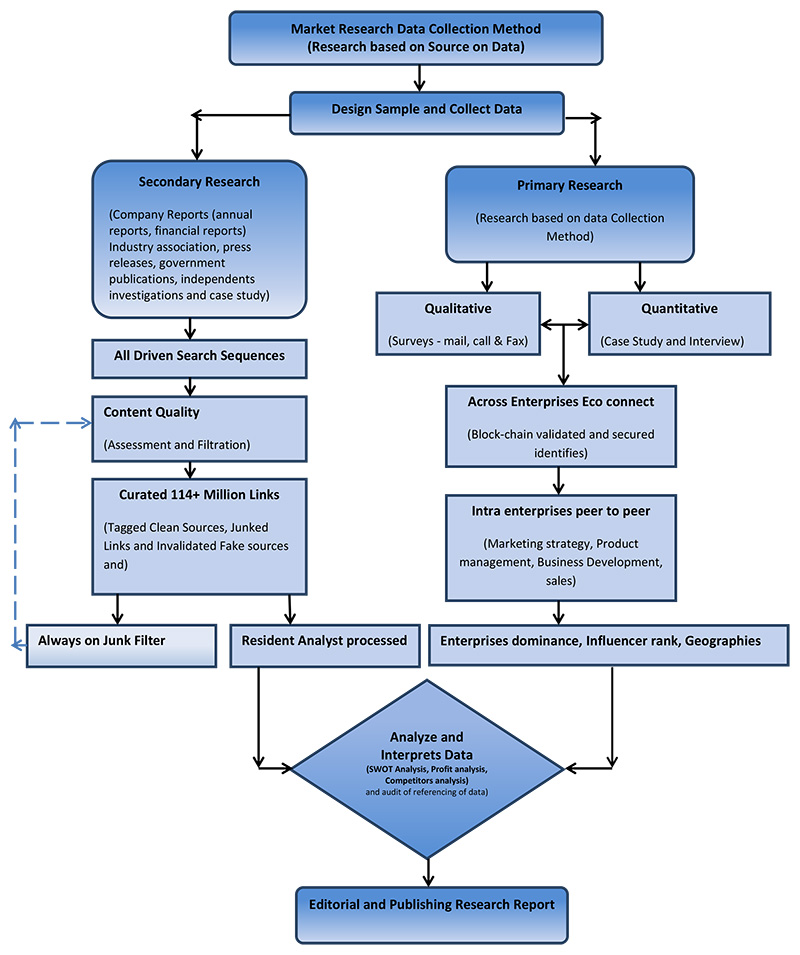
- Robust and transparent research methodology conducted in-country.
- Qualitative and quantitative analysis of the market based on segmentation involving both economic as well as non-economic factors.
- Provision of market value (USD Billion) data for each segment and sub-segment.
- Analysis by geography, region, Country, and its states.
- A brief overview of the commercial potential of products, technologies, and applications.
- Company profiles of leading market participants dealing in products category.
- Description of properties and manufacturing processes.
- marketed segments on the basis of type, application, end users, region, and others.
- Discussion of the current state, setbacks, innovations, and future needs of the market.
- Examination of the market by application and by product sizes; utility-scale, medium scale and small-scale.
- Country-specific data and analysis for the United States, Russia, China, Germany, United Kingdom, France, Japan, Israel, Saudi Arabia, South Korea, United Arab Emirates, Canada, Switzerland, Australia, India, Italy, Turkey, Qatar, Sweden, Spain, Belgium, Netherlands, Norway, Singapore, Egypt, Denmark, Austria, Vietnam, Brazil, Argentina, Mexico, South Africa, and others.
- Coverage of historical overview, key industrial development and regulatory framework.
- Analysis of competitive developments, such as contracts & agreements, expansions, new product developments, and mergers & acquisitions in the market.
- A look at the opportunities in the market for stakeholders and provide a competitive landscape of the market leaders.
Reports Scope and Segments:
| Report Attribute | Details |
| Market size value in 2022 | USD 17.5 Billion |
| Revenue forecast in 2030 | USD 28 Billion |
| Growth Rate | CAGR of 6% from 2022 to 2030 |
| Base year for estimation | 2022 |
| Historical data | 2015 – 2021 |
| Forecast period | 2022 – 2030 |
| Quantitative units | Revenue in USD million and CAGR from 2022 to 2030 |
| Report coverage | Revenue forecast, company ranking, competitive landscape, growth factors, trends, DROT Analysis, Market Dynamics and Challenges, and Strategic Growth Initiatives
COVID-19 Impact, Market Growth Trends, Market Limiters, Competitive Analysis & SWOT for Top Competitors, Mergers & Acquisitions, Company Profiles, Product Portfolios, Disease Overviews. Market Size, Market Shares, Market Forecasts, Market Growth Rates, Units Sold, and Average Selling Prices. |
| Segments covered | Product, Type, Operation, Technology, Application, Region |
| Regional scope | North America; Europe; Asia Pacific; Latin America; Middle East and Africa and rest of the world |
| Country scope | United States, Russia, China, Germany, United Kingdom, France, Japan, Israel, Saudi Arabia, South Korea, United Arab Emirates, Canada, Switzerland, Australia, India, Italy, Turkey, Qatar, Sweden, Spain, Belgium, Netherlands, Norway, Singapore, Egypt, Denmark, Austria, Vietnam, Brazil, Argentina, Mexico, South Africa, and others. |
| Key companies profiled | Air Products and Chemicals, Inc.; Alfa Laval AB; Ambassador Heat Transfer Co.; Anguil Environmental Systems; API Heat Transfer Inc.; Associated Steam Specialty Co.; Balcke-Durr GmbH; Barriquand Technologies Thermiques; Brask, Inc.; Catylytic Products International; Chart Industries, Inc.; Danfoss A/S; Doosan Corporation; Enerquip, Inc.; Exergy LLC; F.W. Webb Company; Flow Solutions, Inc.; Funke Warmeaustauscher Apparatebau GMB; Gunter AG & Co. KG; Hamon Group; Harsco Industrial Air-X-Changers; Hatfield and Company, Inc.; Heat Transfer Company; Hindustan Dorr-Oliver; Hisaka Works, Ltd.; HRS Heat Exchangers Ltd; Hughes Anderson Heat Exchangers; HYDAC Technology Corporation; JFD Tube and Coil Products, Inc.; Johnson Bros Metal Forming, Co.; Johnson Controls International; Kelvion Holding GmbH; Kerr Pump and Supply, Inc.; Koch Heat Transfer Company; Lincoln Associates; Lytron Inc.; Markair, Inc.; McDermott; Mersen; Pre Heat Inc.; Quintel, Inc.; Radiant Heat Exchanger pvt Ltd.; Royal Hydraulics; Sierra S.p.A; SmartHeat Inc.; Southern Heat Exchanger; SPX FLOW, Inc.; Stoermer Anderson, Inc.; SWEP International AB; Technologies, Inc.; Thermal Transfer Corporation; Thermax Global; Thermofin; Thrush Co, Inc.; Tranter Inc.; Trumbo, Inc.; Tru-Stop Inc.; Vahterus Oy; Whaley Products, Inc.; Xylem Inc. and others |
| Customization scope | Free report customization (equivalent up to 20 analyst’s working days) with purchase. Addition or alteration to country, regional & segment scope. |
| Report Format | PDF, PPT, Excel & Online User Account |
Report Segmented by:
| Type | Material | End Use | Region |
| Shell & Tube | Steel | Chemical | North America |
| Plate & Frame | Non-Steel | Energy | Europe |
| Air Cooled | Other Metal/alloy | HVAC | Asia Pacific |
| Cooling Towers | Oil & Gas | South America | |
| Gasketed PHE | Pulp & Paper | Middle East | |
| Welded PHE | Power | Africa | |
| Brazed PHE | Food & Beverages | ||
| Pharmaceuticals | |||
| Automobiles |
Companies Covered in Report:
| Air Products and Chemicals, Inc. | Johnson Controls International |
| Alfa Laval AB | Kelvion Holding GmbH |
| Ambassador Heat Transfer Co. | Kerr Pump and Supply, Inc. |
| Anguil Environmental Systems | Koch Heat Transfer Company |
| API Heat Transfer Inc. | Lincoln Associates |
| Associated Steam Specialty Co. | Lytron Inc. |
| Balcke-Durr GmbH | Markair, Inc. |
| Barriquand Technologies Thermiques | McDermott |
| Brask, Inc. | Mersen |
| Catylytic Products International | Pre Heat Inc. |
| Chart Industries, Inc. | Quintel, Inc. |
| Danfoss A/S | Radiant Heat Exchanger pvt Ltd. |
| Doosan Corporation | Royal Hydraulics |
| Enerquip, Inc. | Sierra S.p.A |
| Exergy LLC | SmartHeat Inc. |
| F.W. Webb Company | Southern Heat Exchanger |
| Flow Solutions, Inc. | SPX FLOW, Inc. |
| Funke Warmeaustauscher Apparatebau GMB | Stoermer Anderson, Inc. |
| Gunter AG & Co. KG | SWEP International AB |
| Hamon Group | Technologies, Inc. |
| Harsco Industrial Air-X-Changers | Thermal Transfer Corporation |
| Hatfield and Company, Inc. | Thermax Global |
| Heat Transfer Company | Thermofin |
| Hindustan Dorr-Oliver | Thrush Co, Inc. |
| Hisaka Works, Ltd. | Tranter Inc. |
| HRS Heat Exchangers Ltd | Trumbo, Inc. |
| Hughes Anderson Heat Exchangers | Tru-Stop Inc. |
| HYDAC Technology Corporation | Vahterus Oy |
| JFD Tube and Coil Products, Inc. | Whaley Products, Inc. |
| Johnson Bros Metal Forming, Co. | Xylem Inc. |
After Sales Support
- Every updated edition of the report and full data stack will be provided at no extra cost for 24 months.
- Latest 2022 base year report.
- Free Updated edition of 2023 every quarter without any hidden cost.
- No user limitation for the report. Unlimited access within the organization.
- Unrestricted post-sales support at no additional cost
- Free report customization (equivalent up to 10 analyst’s working days) with purchase. Addition or alteration to country, regional & segment scope
- Global Industry Reports will support your post-purchase for a period of 24 months to answer any of your queries related to the following market and to provide you any more data needed, for your analysis.
- Option to purchase regional or some selected Chapters from the report.
Key questions that are answered in this report
- How big is the heat exchanger market?
- What is the heat exchanger market growth?
- Which segment accounted for the largest heat exchanger market share?
- Who are the key players in the heat exchanger market?
- What are the factors driving the heat exchanger market?