Global Conductive Inks Market Analysis 2023-2027

  • Publish Date
    May 14, 2023
  • No of Pages
    220
  • SKU Code
    GIR 7913
  • Format

Report Overview

  • Understand the latest market trends and future growth opportunities for the Conductive Inks industry globally with research from the Global Industry Reports team of in-country analysts – experts by industry and geographic specialization.
  • Key trends are clearly and succinctly summarized alongside the most current research data available. Understand and assess competitive threats and plan corporate strategy with our qualitative analysis, insight, and confident growth projections.
  • The report will cover the overall analysis and insights in relation to the size and growth rate of the “Conductive Inks Market” by various segments at a global and regional level for the 2010-2027 period, with 2010-2022 as historical data, 2022 as a base year, 2023 as an estimated year and 2023-2027 as forecast period.

Description:

  • The growth in printed/flexible/hybrid electronics, especially where it enables new applications and even business models such as electronic skin patches for remote health monitoring and smart packaging, will drive the growth of the conductive ink market over the next decade. Furthermore, many emerging applications, such is in-mold electronics, e-textiles and high-frequency antennas, have specific ink requirements that provides an opportunity for differentiation.
  • In the changed post COVID-19 business landscape, the global market for Conductive Inks estimated at US$3.6 Billion in the year 2021, is projected to reach a revised size of US$4 Billion by 2027, growing at a CAGR of 4% over the analysis period 2021-2027. Silver Ink, one of the segments analyzed in the report, is projected to record a 4.7% CAGR and reach US$1.6 Billion by the end of the analysis period. Considering the ongoing post pandemic recovery, growth in the Carbon / Graphene segment is readjusted to a revised 4% CAGR for the next 7-year period.
  • The Conductive Inks market in the U.S. is estimated at US$819.6 Million in the year 2021. China, the world`s second largest economy, is forecast to reach a projected market size of US$812.9 Million by the year 2027 trailing a CAGR of 6.5% over the analysis period 2021 to 2027. Among the other noteworthy geographic markets are Japan and Canada, each forecast to grow at 2.2% and 3.2% respectively over the 2021-2027 period. Within Europe, Germany is forecast to grow at approximately 2.9% CAGR. Led by countries such as Australia, India, and South Korea, the market in Asia-Pacific is forecast to reach US$522.6 Million by the year 2027.
  • In the global Carbon Nanoparticle segment, USA, Canada, Japan, China and Europe will drive the 3.2% CAGR estimated for this segment. These regional markets accounting for a combined market size of US$339.4 Million in the year 2021 will reach a projected size of US$418.3 Million by the close of the analysis period. China will remain among the fastest growing in this cluster of regional markets. Latin America will expand at a 3.4% CAGR through the analysis period.

Conductive Inks Market

MARKET DATA INCLUDED

  • Unit SalesAverage Selling PricesMarket Size & Growth Trends
  • COVID-19 Impact  and Global Recession Analysis
  • Analysis  of US  inflation reduction act 2022
  • Global competitiveness and key competitor percentage market shares
  • Market presence across multiple geographies – Strong/Active/Niche/Trivial
  • Online interactive peer-to-peer collaborative bespoke updates
  • Market Drivers & Limiters
  • Market Forecasts Until 2027, and Historical Data to 2015
  • Recent Mergers & Acquisitions
  • Company Profiles and Product Portfolios
  • Leading Competitors

The Conductive Inks Report Includes:

  • The report provides a deep dive into details of the industry including definitions, classifications, and industry chain structure.
  • Analysis of key supply-side and demand trends.
  • Detailed segmentation of international and local products.
  • Historic volume and value sizes, company, and brand market shares.
  • Five-year forecasts of market trends and market growth.
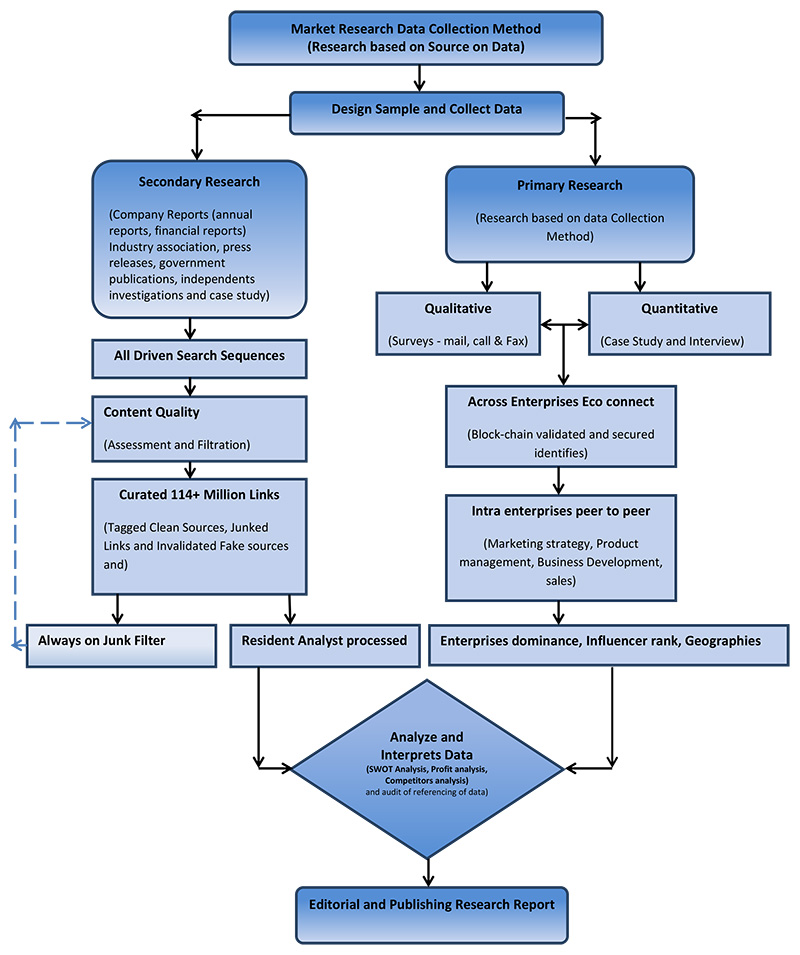
  • Robust and transparent research methodology conducted in-country.
  • Qualitative and quantitative analysis of the market based on segmentation involving both economic as well as non-economic factors.
  • Provision of market value (USD Billion) data for each segment and sub-segment.
  • Analysis by geography, region, Country, and its states.
  • A brief overview of the commercial potential of products, technologies, and applications.
  • Company profiles of leading market participants dealing in products category.
  • Description of properties and manufacturing processes.
  • marketed segments on the basis of type, application, end users, region, and others.
  • Discussion of the current state, setbacks, innovations, and future needs of the market.
  • Examination of the market by application and by product sizes; utility-scale, medium scale and small-scale.
  • Country-specific data and analysis for the United States, Russia, China, Germany, United Kingdom, France, Japan, Israel, Saudi Arabia, South Korea, United Arab Emirates, Canada, Switzerland, Australia, India, Italy, Turkey, Qatar, Sweden, Spain, Belgium, Netherlands, Norway, Singapore, Egypt, Denmark, Austria, Vietnam, Brazil, Argentina, Mexico, South Africa, and others.
  • Coverage of historical overview, key industrial development and regulatory framework.
  • Analysis of competitive developments, such as contracts & agreements, expansions, new product developments, and mergers & acquisitions in the market.
  • A look at the opportunities in the market for stakeholders and provide a competitive landscape of the market leaders.

Reports Scope and Segments:

Report Attribute Details
Market size value in 2021 USD 3.6 Billion
Revenue forecast in 2027 USD  Billion
Growth Rate CAGR of 4% from 2023 to 2027
Base year for estimation 2022
Historical data 2015 – 2022
Forecast period 2023 – 2027
Quantitative units Revenue in USD million and CAGR from 2023 to 2027
Report coverage Revenue forecast, company ranking, competitive landscape, growth factors, trends, DROT Analysis, Market Dynamics and Challenges, and Strategic Growth InitiativesCOVID-19 Impact, Market Growth Trends, Market Limiters, Competitive Analysis & SWOT for Top Competitors, Mergers & Acquisitions, Company Profiles, Product Portfolios, Disease Overviews.

Market Size, Market Shares, Market Forecasts, Market Growth Rates, Units Sold, and Average Selling Prices.

Segments covered Product, Type, Technology, Application, Region
Regional scope North America; Europe; Asia Pacific; Latin America; Middle East and Africa and rest of the world
Country scope United States, Russia, China, Germany, United Kingdom, France, Japan, Israel, Saudi Arabia, South Korea, United Arab Emirates, Canada, Switzerland, Australia, India, Italy, Turkey, Qatar, Sweden, Spain, Belgium, Netherlands, Norway, Singapore, Egypt, Denmark, Austria, Vietnam, Brazil, Argentina, Mexico, South Africa, and others.
Key companies profiled ACI Materials; Advanced Nano Products; Agfa-Gevaert NV; American Elements; Applied Nanotech Holdings, Inc.; Bando; BASF SE; C3 Nano; Cambrios; ChemCubed; Copprint; Creative Materials, Inc.; DuPont; Dycotec; E2IP; Elantas; Electroninks; Engineered Materials Systems; Epoxies, Etc; EverZinc; Fujikura Ltd.; GenseInk; Griller-Werke AG; Henkel Ag & Co. KgaA; Heraeus Holding; Inframat Advanced Material LLC; Inkron; InkTec; Johnson Matthey Colour Technologies; Lanxess Corporation; Liquid Wire; Liquid X; Mateprincs; Methode Electronics; Micronisers Pty Ltd; Nagase America Corporation; Nano Dimension; Nano Labs; NanoCnet; Nanophase Technologies Corporation; NanOrbital; N-ink; Novacentrix; OrelTech; Pan-Continental Chemical Co. Ltd.; PChem Associates, Inc.; Poly-Ink; PPG Industries, Inc.; PrintCB; Promethean Particles; PVNanoCell; Sakai Chemical Industry Co. Ltd.; Saralon; Showa Denko Materials Co. Ltd.; Sigma-Aldrich Co. LLC; Sun Chemical Corporation; U.S. Research Nanomaterials Inc.; Umicore N.V.; UT Dots; Vorbeck Materials Corp.; Voxel8; Zero Valent Nano Metals and others
Customization scope Free report customization (equivalent up to 10 analyst’s working days) with purchase. Addition or alteration to country, regional & segment scope.
Report Format PDF, PPT, Excel & Online User Account

Product Outlook (Volume, Kilotons, Revenue, USD Million, 2021 – 2027)

  • Conductive silver ink
  • Conductive copper ink
  • Conductive polymers
  • Carbon nanotube ink
  • Dielectric inks
  • Carbon/Graphene ink
  • Others

Application Outlook (Volume, Kilotons, Revenue, USD Million, 2019 – 2030)

  • Photovoltaic
  • Membrane switches
  • Displays
  • Automotive
  • Smart packaging
  • Biosensors
  • Printed circuit boards
  • Other applications

Key Market Players

ACI Materials Griller-Werke AG OrelTech
Advanced Nano Products Henkel Ag & Co. KgaA Pan-Continental Chemical Co. Ltd.
American Elements Heraeus Holding PChem Associates, Inc.
Applied Nanotech Holdings, Inc. Inframat Advanced Material LLC Poly-Ink
Bando Inkron PPG Industries, Inc.
BASF SE InkTec PrintCB
C3 Nano Johnson Matthey Colour Technologies Promethean Particles
Cambrios Lanxess Corporation PVNanoCell
ChemCubed Liquid Wire Sakai Chemical Industry Co. Ltd.
Copprint Liquid X Saralon
Creative Materials, Inc. Mateprincs Showa Denko Materials Co. Ltd.
DuPont Methode Electronics Sigma-Aldrich Co. LLC
Dycotec Micronisers Pty Ltd Sun Chemical Corporation
E2IP Nagase America Corporation U.S. Research Nanomaterials Inc.
Elantas Nano Dimension Umicore N.V.
Electroninks Nano Labs UT Dots
Engineered Materials Systems NanoCnet Vorbeck Materials Corp.
Epoxies, Etc Nanophase Technologies Corporation Voxel8
EverZinc NanOrbital Zero Valent Nano Metals
Fujikura Ltd. N-ink
GenseInk Novacentrix

Recent Developments

  • On March 21, 2022, DuPont (NYSE:DD) Microcircuit and Component Materials (MCM) business announced the launch of new Silver/Silver Chloride (Ag/AgCl) conductive ink/paste for health care applications. The 5881 Silver/Silver Chloride conductive paste is used in the health care field to meet the increased needs of doctors and patients that utilize these devices every day by helping them provide confidence in real time information on the health of the patient.
  • On September 9, 2020, Nanotech Energy Inc., a manufacturer of the purest graphene, announced it had developed and scaled a process for the production of graphene with more than 90% of its content being monolayers, the purest form of graphene available in mass production quantities. Nanotech plans to install two graphene product lines to address the market need for graphene sheets with low oxygen content. The first product line is expected to contain an oxygen content of nearly 13%-15%, while the second product line is likely to contain just 3% oxygen content.
  • On May 29, 2020, Creative Materials Inc., based in Ayer, Massachusetts, the U.S., introduced a new gold conductive ink, coating, and adhesive. This substance adheres well to smooth high-energy surfaces such as polyimide, polyester, and glass. Unlike traditional gold inks, CMI’s 128-24 provides excellent coverage at a moderate cost. Working electrodes, transdermal medication delivery, electrochemical sensors, tens electrodes, and muscle stimulation devices are some of its applications. When smooth surfaces or fine features are not required, the substance is helpful in printing non-oxidizing gold electrodes.

After Sales Support

  • Every updated edition of the report and full data stack will be provided at no extra cost for 24 months.
  • Latest 2021 base year report.
  • Free Updated edition of 2023 without any hidden cost.
  • No user limitation for the report. Unlimited access within the organization.
  • Unrestricted post-sales support at no additional cost
  • Free report customization (equivalent up to 10 analyst’s working days) with purchase. Addition or alteration to country, regional & segment scope
  • Global Industry Reports will support your post-purchase for a period of 24 months to answer any of your queries related to the following market and to provide you any more data needed, for your analysis.
  • Option to purchase regional or some selected Chapters from the report.

Key questions answered in this report

  • What types of conductive inks are produced by each supplier?
  • How will rising silver prices impact the conductive ink market?
  • What are the requirements for each conductive ink application, and how much ink is used in each?
  • What is the technological and market readiness of each conductive ink application?
  • What are the key growth opportunities where there is scope for differentiation
1. EXECUTIVE SUMMARY
1.1. Introduction to conductive inks
1.2. Market evolution and new opportunities
1.3. What are the key growth markets for conductive inks?
1.4. Balancing differentiation and ease of adoption (I)
1.5. Balancing differentiation and ease of adoption (II)
1.6. Capturing value from conductive ink facilitated digitization via collaboration
1.7. Reducing adoption barriers by supplying both printer and ink
1.8. Rheology and viscosity: Important considerations in determining printer compatibility
1.9. Strategies for conductive ink cost reduction
1.10. Rising material prices expected to drive alternatives to flake-based inks
1.11. Segmenting conductive ink materials
1.12. Segmentation of conductive ink technologies used in this report
1.13. Readiness level of conductive inks
1.14. Flake-based silver inks: Conclusions
1.15. Nanoparticle-based silver inks: Conclusions
1.16. Particle-free conductive inks: Conclusions
1.17. Copper inks: Conclusions
1.18. Carbon-based inks (including graphene and CNTs): Conclusions
1.19. Stretchable/thermoformable inks: Conclusions
1.20. Silver nanowires: Conclusions
1.21. Conductive polymer ink types: Conclusions
1.22. Applications for conductive inks: Overview
1.23. Technological and commercial readiness of conductive ink applications
1.24. Forecast: Overall conductive ink volume (segmented by ink type)
1.25. Forecast: Overall conductive ink revenue (segmented by ink type)
2. INTRODUCTION
2.1. Mapping conductivity vs application
2.2. Conductivity requirements by application
2.3. Challenges of comparing conductive inks
2.4. Converting conductivity to sheet resistance
2.5. Motivation for using printed electronics (and hence conductive inks)
2.6. Frequency dependent conductivity for antennas and EMI shielding
2.7. Conductive ink suppliers: Specialization vs broad portfolio
2.8. Conductive ink companies segmented by conductive material
2.9. Insights from company segmentation by conductive material
2.10. Conductive ink companies segmented by composition
2.11. Insights from company segmentation by formulation
3. MARKET FORECASTS
3.1. Market forecasting methodology
3.2. Forecasting across conductive ink applications (I)
3.3. Forecasting across conductive ink applications (II)
3.4. Information acquisition for conductive ink forecasts
3.5. Forecast: Overall conductive ink volume (segmented by ink type)
3.6. Forecast: Overall conductive ink revenue (segmented by ink type)
3.7. Forecast: Conductive inks for flexible hybrid electronics (FHE)
3.8. Forecast: Conductive inks for in-mold electronics (IME)
3.9. Forecast: Conductive inks for 3D electronics (partially additive)
3.10. Forecast: Conductive inks for 3D electronics (fully additive)
3.11. Forecast: Conductive inks e-textiles
3.12. Forecast: Conductive inks for circuit prototyping
3.13. Forecast: Conductive inks for capacitive sensors
3.14. Forecast: Conductive inks for pressure sensors
3.15. Forecast: Conductive inks for biosensors
3.16. Forecast: Conductive inks for strain sensors
3.17. Forecast: Conductive inks for wearable electrodes
3.18. Forecast: Conductive inks for photovoltaics (conventional/rigid)
3.19. Forecast: Conductive inks for photovoltaics (flexible)
3.20. Forecast: Conductive inks for printed heaters
3.21. Forecast: Conductive inks for EMI shielding
3.22. Forecast: Conductive inks for antennas (for communications)
3.23. Forecast: Conductive inks for RFID and smart packaging
4. CONDUCTIVE INK TECHNOLOGIES
4.1.1. Segmenting the conductive ink landscape
4.1.2. Segmentation of conductive ink technologies used in this report
4.1.3. Benchmarking conductive ink properties
4.2. Flake-based silver inks
4.2.1. Thinner flakes improves conductivity and durability
4.2.2. Flake-based silver ink value chain
4.2.3. High resolution functional screen printing
4.2.4. Is silver electromigration a concern?
4.2.5. Comparing properties of flake-based silver inks
4.2.6. SWOT analysis: Flake-based inks
4.2.7. Flake-based silver inks: Conclusions
4.3. Nanoparticle-based silver inks
4.3.1. Silver nanoparticle inks: Key value propositions
4.3.2. Silver nanoparticle inks: higher conductivity
4.3.3. Are you buying ink or buying conductivity?
4.3.4. Microstructural homogeneity increases conductivity
4.3.5. Additional benefits of nanoparticle inks
4.3.6. Price competitiveness of silver nanoparticles
4.3.7. Ag nanoparticle inks: Do they really cure fast and at lower temperatures?
4.3.8. Benchmarking parameters for silver nanoparticle production methods
4.3.9. Comparing silver nanoparticle production methods (I)
4.3.10. Comparing silver nanoparticle production methods (II)
4.3.11. Multiple application opportunities for nanoparticle inks
4.3.12. Overview of selected nanoparticle ink manufacturers
4.3.13. Comparing properties of nanoparticle-based silver inks
4.3.14. SWOT analysis: Nanoparticle inks
4.3.15. Nanoparticle-based silver inks: Conclusions
4.4. Particle-free inks
4.4.1. Particle-free (molecular) conductive inks: An introduction
4.4.2. Operating principle of particle-free inks
4.4.3. Conductivity close to bulk metals
4.4.4. Highly smooth surfaces for high-frequency conductivity
4.4.5. Low viscosity enables high resolution digital printing methods
4.4.6. Permeability of particle-free inks enables conductive textiles
4.4.7. Thermoformable particle-free inks for in-mold electronics
4.4.8. Application opportunities for particle free inks
4.4.9. Value propositions of particle-free inks
4.4.10. Particle-free conductive inks for different metals
4.4.11. Differentiating particle-free conductive inks with sintering requirements
4.4.12. Overview of particle free ink manufacturers
4.4.13. Comparing properties of particle-free silver inks
4.4.14. SWOT analysis: Particle-free conductive inks
4.4.15. Particle-free conductive inks: Conclusions
4.5. Copper inks
4.5.1. Copper inks: An introduction
4.5.2. Challenges in developing copper inks
4.5.3. Commercially unsuccessful strategies to avoid copper oxidation
4.5.4. Strategies to avoid copper oxidation: Reducing agent additives
4.5.5. Strategies to avoid copper oxidation: Photonic sintering
4.5.6. Growing interest in utilizing copper ink for FHE (I)
4.5.7. Growing interest in utilizing copper ink for FHE (II)
4.5.8. Recent collaborations utilizing copper inks
4.5.9. PrintCB: Two component copper ink based on micron-scale particles
4.5.10. Copprint: Commercializing nano-particle based copper
4.5.11. Overview of early-stage copper ink companies
4.5.12. Comparing properties of selected copper inks
4.5.13. SWOT analysis: Copper-based inks
4.5.14. Copper inks: Conclusions
4.6. Carbon based inks (including graphene and CNTs)
4.6.1. Carbon based inks (including graphene and CNTs): An introduction
4.6.2. Carbon-based inks: two distinct categories
4.6.3. CNTs as a transparent conductive ink
4.6.4. Material properties of transparent conductive materials
4.6.5. Overview of graphene/CNT ink companies
4.6.6. Comparing properties of selected copper inks
4.6.7. SWOT analysis: Carbon black conductive inks
4.6.8. Nano-structured carbon conductive inks: SWOT
4.6.9. Carbon-based inks (including graphene and CNTs): Conclusions
4.7. Stretchable/thermoformable inks
4.7.1. Stretchable/thermoformable inks: An introduction
4.7.2. Stretchable vs thermoformable conductive inks
4.7.3. The role of particle size in stretchable inks
4.7.4. New ink requirements: Portfolio approach
4.7.5. Stretchable and thermoformable electronics: Technology readiness
4.7.6. Innovations in stretchable conductive ink
4.7.7. Metal gel as a stretchable ink
4.7.8. Comparing properties of stretchable/thermoformable conductive inks
4.7.9. Company profiles: Stretchable/thermoformable ink
4.7.10. Stretchable/thermoformable inks: SWOT
4.7.11. Stretchable/thermoformable inks: Conclusions
4.8. Silver nanowires
4.8.1. Silver nanowires: An introduction
4.8.2. Benefits of silver nanowire TCFs
4.8.3. Drawbacks of silver nanowire TCFs
4.8.4. Value chain for silver nanowires
4.8.5. Percolation thresholds and aspect ratio
4.8.6. AgNW TCF durability and flexibility
4.8.7. Improving material properties – gluing and ‘welding’
4.8.8. Improving material properties – coating and encapsulation
4.8.9. Silver nanowires gain traction in touchscreens
4.8.10. Silver nanowires for transparent heaters
4.8.11. Technology readiness level snapshot of silver nanowire technologies
4.8.12. Global distribution of silver nanowire producers
4.8.13. SWOT analysis of silver nanowire TCFs
4.8.14. Silver nanowires: Conclusions
4.9. Conductive polymers
4.9.1. Conductive polymers: An introduction
4.9.2. Polythiophene-based conductive films for flexible devices
4.9.3. Applications for conductive polymers for transparent capacitive touch and e-textiles
4.9.4. Emerging sensitive sensor readout facilitates conductive polymers for capacitive touch
4.9.5. Innovative n-type conductive polymer
4.9.6. Conductive polymer inks: SWOT
4.9.7. Conductive polymer ink types: Conclusions
5. APPLICATIONS FOR CONDUCTIVE INKS
5.1.1. Applications for conductive inks: Overview
5.1.2. Benchmarking conductive ink application requirements
5.1.3. Technological and commercial readiness of conductive ink applications
5.1.4. Applications for conductive inks: Included content
5.2. Conductive ink for circuit manufacturing
5.2.1. Conductive ink for circuit manufacturing
5.3. Flexible hybrid electronics (FHE)
5.3.1. FHE: Best of both approaches
5.3.2. What counts as FHE?
5.3.3. Flexible hybrid electronics (FHE)
5.3.4. FHE value chain: Many materials and technologies
5.3.5. Wearable skin patches – another stretchable ink application
5.3.6. Condition monitoring multimodal sensor array
5.3.7. Multi-sensor wireless asset tracking system demonstrates FHE potential
5.3.8. Conductive ink requirements for flexible hybrid electronics (FHE)
5.3.9. SWOT analysis: Flexible hybrid electronics (FHE)
5.3.10. Flexible hybrid electronics (FHE): Conclusions
5.4. In-mold electronics (IME)
5.4.1. Introduction to in-mold electronics (IME)
5.4.2. IME manufacturing process flow
5.4.3. Commercial advantages of IME
5.4.4. IME value chain overview
5.4.5. IME requires a wide range of specialist materials
5.4.6. In-mold electronics requires stretchability
5.4.7. Materials for IME: A portfolio approach
5.4.8. All materials in the stack must be compatible: Conductivity perspective
5.4.9. Silver flake-based ink dominates IME
5.4.10. In-mold electronics requires thermoformable conductive inks (I)
5.4.11. Conductive ink requirements for in-mold electronics
5.4.12. SWOT analysis: In-mold electronics
5.4.13. In-mold electronics (IME): Conclusions
5.5. 3D electronics
5.5.1. Additive electronics and the transition to three dimensions
5.5.2. Advantages of fully additively manufactured 3D electronics
5.5.3. Fully 3D printed electronics
5.5.4. Examples of fully 3D printed circuits
5.5.5. Conductive ink requirements for 3D electronics
5.5.6. SWOT analysis: 3D printed electronics
5.5.7. 3D electronics: Conclusions
5.6. E-textiles
5.6.1. E-Textiles: Where textiles meet electronics
5.6.2. E-textile industry challenges
5.6.3. Biometric monitoring in apparel
5.6.4. Sensing functionality woven into textiles
5.6.5. Commercial progress with e-textile projects
5.6.6. Conductive ink requirements for e-textiles
5.6.7. E-textiles: SWOT analysis
5.6.8. E-textiles: Conclusions
5.7. Circuit prototyping
5.7.1. PCB prototyping and ‘print-then-plate’ methodologies.
5.7.2. Circuit prototyping and 3D electronics landscape
5.7.3. Conductive ink requirements for circuit prototyping
5.7.4. Readiness level of additive manufacturing technologies
5.7.5. Circuit prototyping: SWOT analysis
5.7.6. Circuit prototyping: Conclusions
5.8. Sensing applications for conductive inks
5.8.1. Sensing applications for conductive inks
5.8.2. Industry 4.0 requires printed sensors
5.8.3. Printed/flexible sensors – A growing market for conductive inks
5.8.4. Key markets for printed/flexible sensors
5.9. Capacitive sensing
5.9.1. Capacitive sensors: Working principle
5.9.2. Hybrid capacitive/pressure sensors
5.9.3. Conductive materials for transparent capacitive sensors
5.9.4. Quantitative benchmarking of different transparent conductive film technologies
5.9.5. Use case examples of PEDOT:PSS for capacitive touch sensors
5.9.6. Readiness level of capacitive touch sensors materials and technologies
5.9.7. Conductive ink requirements for capacitive sensors
5.9.8. Printed capacitive sensors: SWOT analysis
5.9.9. Printed capacitive sensors: Conclusions
5.10. Pressure sensors
5.10.1. Printed piezoresistive sensors: An introduction
5.10.2. Force sensitive inks
5.10.3. Mass production of printed sensors
5.10.4. Summary: Printed pressure sensors
5.10.5. Conductive ink requirements for printed pressure sensors
5.10.6. Readiness level snapshot of printed piezoresistive sensors
5.10.7. Piezoresistive sensors: SWOT analysis
5.10.8. Piezoelectric sensors: SWOT analysis
5.10.9. Pressure sensors: Conclusions
5.11. Biosensors
5.11.1. Electrochemical biosensors present a simple sensing mechanism
5.11.2. Biosensor electrode deposition: screen printing vs sputtering
5.11.3. Challenges for printing electrochemical test strips
5.11.4. Printed pH sensors for biological fluids
5.11.5. Conductive ink requirements for printed biosensors
5.11.6. Printed biosensors: SWOT analysis
5.11.7. Readiness level of printed biosensors
5.11.8. Printed biosensors: Conclusions
5.12. Strain sensors
5.12.1. High strain stretchable sensors
5.12.2. ‘Stretchable’ sensors
5.12.3. Capacitive strain sensors
5.12.4. Resistive strain sensors
5.12.5. Conductive ink requirements for printed strain sensors
5.12.6. Printed strain sensors: SWOT analysis
5.12.7. Technology readiness level snapshot of capacitive strain sensors
5.12.8. Printed strain sensors: Conclusions
5.13. Wearable electrodes
5.13.1. Applications and product types
5.13.2. Key requirements of wearable electrodes
5.13.3. Material suppliers collaboration has enabled large scale trials of wearable skin patches
5.13.4. Wet vs dry electrodes
5.13.5. Wet electrodes: The incumbent technology
5.13.6. Dry electrodes: A more durable emerging solution
5.13.7. Stretchable conductive printed electrodes (Nanoleq)
5.13.8. Conductive ink requirements for wearable electrodes/electronic skin patches
5.13.9. Wearable electrodes/electronic skin patches: SWOT analysis
5.13.10. Readiness level of printed wearable electrodes
5.13.11. Wearable electrodes/electronic skin patches: Conclusions
5.14. Other applications for conductive inks
5.14.1. Other applications for conductive inks
5.15. Charge extraction from photovoltaics
5.15.1. Conductive pastes for photovoltaics: Introduction
5.15.2. Reducing silver content per wafer via ink innovations
5.15.3. Flake-based conductive inks face headwind from alternative solar cell connection technology
5.15.4. Photovoltaic market dynamics
5.15.5. Conductive ink requirements for photovoltaics
5.15.6. Charge extraction from photovoltaics: SWOT analysis
5.15.7. Charge extraction from photovoltaics: Conclusions
5.16. Printed heaters
5.16.1. Introduction to printed heaters
5.16.2. Automotive applications for printed heaters
5.16.3. Emerging building-integrated opportunities for printed (and flexible) heaters
5.16.4. Stretchable conductive inks for wearable heaters
5.16.5. Technology comparison for e-textile heating technologies
5.16.6. Heated clothing is the dominant e-textile sector
5.16.7. Conductive ink requirements for printed heaters
5.16.8. Printed heaters: SWOT analysis
5.16.9. Printed heaters: Conclusions
5.17. EMI shielding
5.17.1. What is electromagnetic interference (EMI) shielding?
5.17.2. Process flow for EMI shielding
5.17.3. Spraying EMI shielding: A cost effective solution
5.17.4. Overview of conformal shielding technologies
5.17.5. Particle size and morphology influence EMI shielding
5.17.6. Using hybrid inks improves shielding performance
5.17.7. Suppliers targeting ink-based conformal EMI shielding
5.17.8. EMI shielding with particle-free Ag inks
5.17.9. EMI shielding and heterogeneous integration
5.17.10. Conductive ink requirements for EMI shielding
5.17.11. EMI shielding: SWOT analysis
5.17.12. EMI shielding: Conclusions
5.18. Printed antennas
5.18.1. Segmenting printed antennas
5.18.2. Electronics on 3D surfaces with extruded conductive paste and inkjet printing
5.18.3. Extruded conductive paste for antennas
5.18.4. Addressable market verticals for transparent antennas
5.18.5. Automotive transparent antennas
5.18.6. Building integrated transparent antennas
5.18.7. Transparent antennas for consumer electronic devices
5.18.8. Transparent antennas for smart packaging
5.18.9. Conductive ink requirements for printed antennas
5.18.10. Printed antennas: SWOT analysis
5.18.11. Printed antennas: Conclusions
5.19. RFID and smart packaging
5.19.1. RFID and smart packaging: An introduction
5.19.2. Largest RFID markets in 2022 vs 2032
5.19.3. RFID technologies: The big picture
5.19.4. Printed RFID antennas struggle for traction: Is copper ink a solution?
5.19.5. Smart packaging with flexible hybrid electronics
5.19.6. ‘Sensor-less’ sensing of temperature and movement
5.19.7. Conductive ink requirements for RFID and smart packaging
5.19.8. RFID and smart packaging: SWOT analysis
5.19.9. RFID and smart packaging: Conclusions
6. COMPANY PROFILES
6.1. Agfa
6.2. ACI Materials
6.3. Advanced Nano Products
6.4. Bando
6.5. C3 Nano
6.6. Cambrios
6.7. Copprint
6.8. ChemCubed
6.9. DuPont
6.10. Dycotec
6.11. E2IP
6.12. Electroninks
6.13. Elantas
6.14. GenseInk
6.15. Henkel
6.16. Heraeus
6.17. Inkron
6.18. InkTec
6.19. Liquid Wire
6.20. Liquid X
6.21. Mateprincs
6.22. NanoCnet
6.23. Nano Dimension
6.24. NanOrbital
6.25. N-ink
6.26. NovaCentrix
6.27. OrelTech
6.28. PrintCB
6.29. Promethean Particles
6.30. PVNanoCell
6.31. Saralon
6.32. Sun Chemical
6.33. UT Dots
6.34. Zero Valent Nano Metals

+140 Companies operating in Conductive Inks Market

Methodology

Research Methodology is the process used to collect information and data for the purpose of making business decisions. The success of a research project is entirely dependent on the research methodology adopted by the company. Research Methodology and Scope We have implemented a mix of primary and secondary research for our market estimate and forecast. Secondary research formed the initial phase of our study, where we conducted extensive data mining, referring to verified data sources such as independent studies, company annual reports, white papers, case studies, government and regulatory published articles, technical journals, magazines, and paid data sources. It was also used to obtain important information about the key players and market classification & segmentation according to industry trends to the bottom-most level, and key developments related to market and technology perspectives. A database of the key industry leaders was also prepared using secondary research.

In the primary research process, various primary sources from both supply and demand sides have been interviewed to obtain qualitative and quantitative information important for respective regions. The primary sources from the supply side included industry experts such as CEOs, VPs, marketing directors, technology and innovation directors, and related executives from key companies and organizations operating in the respective regions. The primary data has been collected through questionnaires, e-mails, and telephonic interviews, end-user surveys, consumer surveys, technology distributors and wholesaler’s surveys.

  • Quantitative methods (e.g. surveys) are best for measuring, ranking, categorizing, identifying patterns and making generalizations
  • Qualitative methods (e.g. interviews) are best for describing, interpreting, contextualizing, and gaining in-depth insight into specific concepts or phenomena
  • Mixed methods allow for a combination of numerical measurement and in-depth exploration.

Market drivers and restraints, along with their current and expected impacts, technological scenario and expected developments, end-use industry trends and dynamics  and consumer behavior trends  these forecasting parameters were considered.

Ethical approach, attention to detail, consistency, latest trend in the market and highly authentic source these are benefits of company’s research methodology.

Global Industry Reports

Market size estimation methodology top-down and bottom-up approaches

Both top-down and bottom-up approaches have been used to estimate and validate the total size of the virtual reality market. These methods have also been extensively used to estimate the sizes of various market subsegments. Estimating the size of the market in each region by adding the sizes of country-wise markets and tracking the ongoing and upcoming implementation of virtual reality projects by various companies in each region and forecasting the size of the virtual reality market based on these developments and other critical parameters, including COVID-19 related impacts

Data Triangulation

After arriving at the overall market size—using the market size estimation processes explained above—the market has been split into several segments and subsegments. To complete the overall market engineering process and arrive at the exact statistics of each market segment and subsegment, data triangulation, and market breakdown procedures have been employed, wherever applicable. The data has been triangulated by studying various factors and trends from both the demand and supply sides. It provide detailed information regarding the major factors (drivers, restraints, opportunities, challenges, company profiles, key player strategies competitive developments and key developments) influencing the virtual reality market growth.

Statistical Model

Our market estimates and forecasts are derived through simulation models. A unique model is created customized for each study. Gathered information for market dynamics, technology landscape, application development and pricing trends is fed into the model and analyzed simultaneously. These factors are studied on a comparative basis, and their impact over the forecast period is quantified with the help of correlation, regression and time series analysis.