Global 3D Printing Market Analysis –Trends, Insights and Forecast (2023-2027)

  • Publish Date
    July 5, 2023
  • No of Pages
    270
  • SKU Code
    GIR 7909
  • Format

Report Overview

  • Understand the latest market trends and future growth opportunities for the 3D Printing industry globally with research from the Global Industry Reports team of in-country analysts – experts by industry and geographic specialization.
  • Key trends are clearly and succinctly summarized alongside the most current research data available. Understand and assess competitive threats and plan corporate strategy with our qualitative analysis, insight, and confident growth projections.
  • The report will cover the overall analysis and insights in relation to the size and growth rate of the “3D Printing Market” by various segments at a global and regional level for the 2010-2027 period, with 2010-2021 as historical data, 2022 as a base year, 2023 as an estimated year and 2023-2028 as forecast period.

Description:

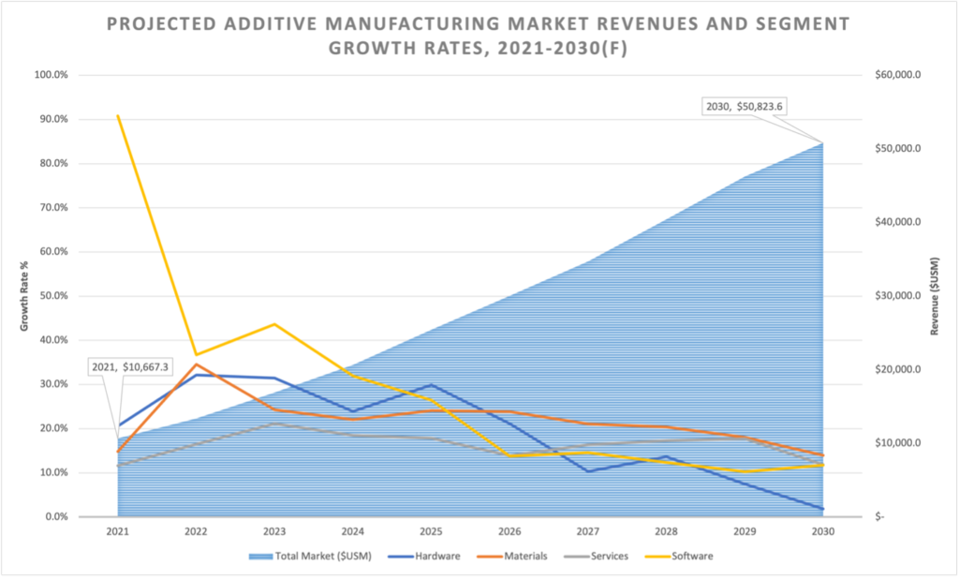
  • In the post COVID-19 business landscape, the global market for 3D Printing estimated at US$20.8 Billion in the year 2022, is projected to reach a revised size of US$45.8 Billion by 2028, growing at a CAGR of 18.5% over the period 2022-2028.
  • Printers, one of the segments analyzed in the report, is projected to record a 14.6% CAGR and reach US$14.5 Billion by the end of the analysis period. After an early analysis of the business implications of the pandemic and its induced economic crisis, growth in the Services segment is readjusted to a revised 18.9% CAGR for the next 7-year period.
  • The 3D Printers market in the U.S. is estimated at US$5 Billion in the year 2022. China, the world`s second largest economy, is forecast to reach a projected market size of US$10.1 Billion by the year 2028 trailing a CAGR of 22.5% over the analysis period 2023 to 2027. Among the other noteworthy geographic markets are Japan and Canada, each forecast to grow at 13.7% and 16.1% respectively over the 2020-2028 period. Within Europe, Germany is forecast to grow at approximately 14.9% CAGR.

3D Printing Market

Covid Impact:

  • Other than the COVID-related dip during 2020, the 3DP/AM market continues to grow steadily, having topped a $5B quarterly base in Q4 2021. In times of global market uncertainty, additive manufacturing represents a rather insulated pocket in terms of market activity.
  • Supply chain disruptions have continued to impact revenue performance across industries and markets, in turn creating demand for additive manufacturing. Partially to this end, the Services represents the largest portion of the whole 3DP/AM market. Materials and Hardware are similar in size at the moment, and Software is the smallest, but fast-growing segment.

MARKET DATA INCLUDED

  • Unit SalesAverage Selling PricesMarket Size & Growth Trends
  • COVID-19 Impact and Global Recession Analysis
  • Analysis of US inflation reduction act 2022
  • Global competitiveness and key competitor percentage market shares
  • Market presence across multiple geographies – Strong/Active/Niche/Trivial
  • Online interactive peer-to-peer collaborative bespoke updates
  • Market Drivers & Limiters
  • Market Forecasts Until 2027, and Historical Data to 2015
  • Recent Mergers & Acquisitions
  • Company Profiles and Product Portfolios
  • Leading Competitors

3D Printing Market Growth 2023

The 3D Printing Report Includes:

  • The report provides a deep dive into details of the industry including definitions, classifications, and industry chain structure.
  • Analysis of key supply-side and demand trends.
  • Detailed segmentation of international and local products.
  • Historic volume and value sizes, company, and brand market shares.
  • Five-year forecasts of market trends and market growth.
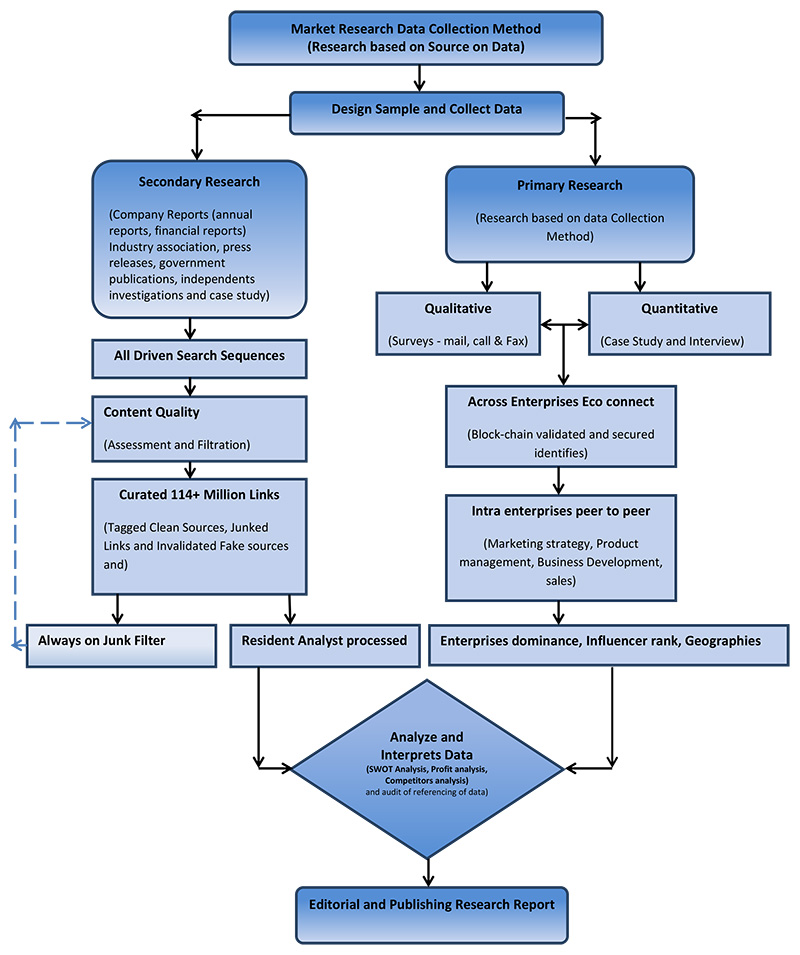
  • Robust and transparent research methodology conducted in-country.
  • Qualitative and quantitative analysis of the market based on segmentation involving both economic as well as non-economic factors.
  • Provision of market value (USD Billion) data for each segment and sub-segment.
  • Analysis by geography, region, Country, and its states.
  • A brief overview of the commercial potential of products, technologies, and applications.
  • Company profiles of leading market participants dealing in products category.
  • Description of properties and manufacturing processes.
  • marketed segments on the basis of type, application, end users, region, and others.
  • Discussion of the current state, setbacks, innovations, and future needs of the market.
  • Examination of the market by application and by product sizes; utility-scale, medium scale and small-scale.
  • Country-specific data and analysis for the United States, Russia, China, Germany, United Kingdom, France, Japan, Israel, Saudi Arabia, South Korea, United Arab Emirates, Canada, Switzerland, Australia, India, Italy, Turkey, Qatar, Sweden, Spain, Belgium, Netherlands, Norway, Singapore, Egypt, Denmark, Austria, Vietnam, Brazil, Argentina, Mexico, South Africa, and others.
  • Coverage of historical overview, key industrial development and regulatory framework.
  • Analysis of competitive developments, such as contracts & agreements, expansions, new product developments, and mergers & acquisitions in the market.
  • A look at the opportunities in the market for stakeholders and provide a competitive landscape of the market leaders.

Reports Scope and Segments:

Report Attribute Details
Market size value in 2021 USD 20.8 Billion
Revenue forecast in 2027 USD 45.8 Billion
Growth Rate CAGR of 18.5% from 2022 to 2028
Base year for estimation 2022
Historical data 2015 – 2021
Forecast period 2022 – 2028
Quantitative units Revenue in USD million and CAGR from 2021 to 2028
Report coverage Revenue forecast, company ranking, competitive landscape, growth factors, trends, DROT Analysis, Market Dynamics and Challenges, and Strategic Growth Initiatives

COVID-19 Impact, Market Growth Trends, Market Limiters, Competitive Analysis & SWOT for Top Competitors, Mergers & Acquisitions, Company Profiles, Product Portfolios, Disease Overviews.

Market Size, Market Shares, Market Forecasts, Market Growth Rates, Units Sold, and Average Selling Prices.

Segments covered Product, Type, Component, Technology, Application, Region
Regional scope North America; Europe; Asia Pacific; Latin America; Middle East and Africa and rest of the world
Country scope United States, Russia, China, Germany, United Kingdom, France, Japan, Israel, Saudi Arabia, South Korea, United Arab Emirates, Canada, Switzerland, Australia, India, Italy, Turkey, Qatar, Sweden, Spain, Belgium, Netherlands, Norway, Singapore, Egypt, Denmark, Austria, Vietnam, Brazil, Argentina, Mexico, South Africa, and others.
Key companies profiled 3D Hubs; 3D Systems; 3D Universal; Additive Industries; AddUp Solutions; Arcam Group; Arconic; Arkema; Autodesk Inc.; BASF; Beam-IT; BigRep; Canon Inc.; Carbon 3D; Carpenter Technology Corporation; Cincinnati Inc.; Covestro; CRP Group; Desktop Metal; DMG Mori; Dutch Filaments B.V.; DWS; EnvisionTec, Inc.; EOS GmbH; Evonik; ExOne GmbH; Farinia; Farsoon; Fast Radius; FATHOM; FIT AG; Forecast3D; Formlab; General Electric Company (GE Additive); GKN Additive; Graphene 3D Lab Inc.; H.C. Starck; Heraeus; Hoganas; HP Inc; i3D MfG; Imagin Plastics Ltd.; Imperial Machine & Tool; Jabil; Leapfrog; Linde; Local Motors; Made In Space; Markforged; Materialise NV; My MiniFactory; Oerlikon; Optomec; Philips; Praxair Surface Technologies; Prodways; Proto Labs; Push Plastic; Rapidshape; Renishaw; Royal DSM N.V.; Sandvik; Shape ways; Siemens; Sintavia; Sisma SPA; SLM Solutions; Solvay; Star Rapid; Stratasys Ltd; Trumpf; Ultimaker; United Coatings Group; Velo3D; Voestalpine; Voxeljet AG; White Clouds; Wipro 3D; Xaar; Xerox; Xilloc; Zortrax and others
Customization scope Free report customization (equivalent up to 20 analyst’s working days) with purchase. Addition or alteration to country, regional & segment scope.
Report Format PDF, PPT, Excel & Online User Account


By Material

  • Polymer
  • Metal
  • Ceramic
  • Composites
  • Construction

By Component

  • Hardware
  • Software
  • Services

By Printer Type

  • Desktop 3D Printer
  • Industrial 3D Printer

By Technology

  • Stereolithography
  • Fused Deposition Modeling
  • Selective Laser Sintering
  • Direct Metal Laser Sintering
  • Polyjet Printing
  • Inkjet Printing
  • Electron Beam Melting
  • Laser Metal Deposition
  • Digital Light Processing
  • Laminated Object Manufacturing
  • Others

By Software

  • Design Software
  • Inspection Software
  • Printer Software
  • Scanning Software

By Application

  • Prototyping
  • Tooling
  • Functional Parts

By Vertical Outlook

  • Industrial 3D Printing
  • Automotive
  • Aerospace & Defense
  • Healthcare
  • Consumer Electronics
  • Industrial
  • Power & Energy
  • Others
  • Desktop 3D Printing
  • Educational Purpose
  • Fashion & Jewelry
  • Objects
  • Dental
  • Food
  • Others


Companies Covered in Report:

3D Hubs Formlab Philips
3D Systems Fraunhofer IKTS Photocentric
3D Universal Gamma Alloys Praxair Surface Technologies
Additive Industries Gefertec Prodways
AddUp Solutions General Electric Company (GE Additive) Proto Labs
AdvancD materials GKN Additive Push Plastic
Arcam Group Glassomer Rapidia
Arconic Graphene 3D Lab Inc. Rapidshape
Arevo H.C. Starck Renishaw
Arkema Headmade Materials Roboze
Arris Composites Heraeus Royal DSM N.V.
Autodesk Inc. Hoganas SAFINA
AzulD HP Inc Sandvik
BASF i3D MfG Schunk Carbon Technology
BCND Technologies Imagin Plastics Ltd. Sciaky
BeAM Machines Imperial Machine & Tool SGL Carbon
Beam-IT Inkbit Shape ways
BigRep Jabil Siemens
Canon Inc. JuggerBotD Sintavia
Carbon 3D Kumovis Sisma SPA
Carpenter Technology Corporation Leapfrog SKFine
Chiron Linde SLM Solutions
Cincinnati Inc. Lithoz Solvay
Continuous Composites Local Motors SPEED
Cookson Precious Metals Lubrizol Star Rapid
Covestro Made In Space Stratasys Ltd
CRP Group Mantle TethonD
D Ceram Markforged Titomic
D Systems Massivit D Tritone Technologies
Desktop Metal Materialise NV Trumpf
DMG Mori Mechnano Ultimaker
Dutch Filaments B.V. Meltio Uniformity Labs
Electroimpact MetallumD United Coatings Group
Elementum D Metalysis UpNano
EnvisionTec, Inc. Mitsubishi Chemical Velo3D
EOS GmbH Moi Composites Voestalpine
Equispheres Molecular Rebar Voxeljet AG
Evolve Additive Solutions MXD WAAMD
Evonik My MiniFactory White Clouds
Exaddon Nano Dimension Wipro 3D
ExOne GmbH NanoAL Xaar
Exponential Nanoe Xerox
Farinia NexaD Xi’an Bright Laser Technology
Farsoon nScrypt Xilloc
Fast Radius Oerlikon XJet
FATHOM One Click Metal Xolo
FIT AG Optomec ZDLAB
Forecast3D Orbital Composites Zortrax

Recent Developments

  • October 2022: AML3D Australian metal 3D printing expanded its partnership with Boing aircraft manufacturer. Boeing tasked AML3D earlier this year with 3D printing aluminum prototype airplane components as part of an intensive testing procedure in which they were tested against the requirements of AS9100D quality assurance for ‘fly’ parts. Building on this contract, it has now been decided to broaden the scope of the project to include the provision of additional 3D-printed components, increasing the agreement’s value by 150%.
  • October 2022: PostProcess Technologies and EOS have launched a distribution relationship to provide EOS clients with a fully automated and sustainable depowering solution. According to PostProcess, the Variable Acoustic Displacement (VAD) technology solution will complement the EOS printer product line and automate gross depowering for 3D printed parts. The partnership makes it easier for consumers to obtain post-printing solutions, allowing for complete process digitization.
  • February 2022 – Imaginarium, one of the global leaders in 3D Printing solutions and advanced manufacturing technology, announced the launch of its desktop and industrial 3D printer range in partnership with 3D printing giant Ultimaker.

 After Sales Support

  • Every updated edition of the report and full data stack will be provided at no extra cost for 24 months.
  • Latest 2022 base year report.
  • Free Updated edition of 2023 every quarter without any hidden cost.
  • No user limitation for the report. Unlimited access within the organization.
  • Unrestricted post-sales support at no additional cost
  • Free report customization (equivalent up to 10 analyst’s working days) with purchase. Addition or alteration to country, regional & segment scope
  • Global Industry Reports will support your post-purchase for a period of 24 months to answer any of your queries related to the following market and to provide you any more data needed, for your analysis.
  • Option to purchase regional or some selected Chapters from the report.

Key questions that are answered in this report

  • What are the current and emerging printer technology types within different material specialties?
  • How do metrics such as price, build speed, build volume and precision vary by printer type and material class?
  • What are the strengths and weaknesses of different 3D printing technologies?
  • Which printers support different material classes?
  • What is the current installed base of 3D printers?
  • Who are the main players?
  • What are the market shares of those active in the market?
  • What are the current and emerging 3D printing materials in 2023?
  • What are the market shares of each material class?
  • What are the key drivers and restraints of market growth?
  • What are the main application areas of additive manufacturing?
  • How does 3D printing hardware and materials relate to post-processing, software, scanners, and services?
  • How will sales of different printer types evolve from 2022 to 2028?
  • What is the projected demand by mass and annual revenue growth for materials from 2022 to 2028?
  • How has COVID-19 positively or negatively impacted the 3D printing industry?
Table of Contents
1. EXECUTIVE SUMMARY
1.1. Why adopt 3D printing?
1.2. Material compatibility across 3D printing technologies
1.3. Drivers and restraints of growth for 3D printing
1.4. Overview of Polymer 3D Printing Technologies
1.5. Breaking down polymer materials for 3D printing
1.6. Overview of Metal 3D Printing Technologies
1.7. Overview of Metal AM Feedstock Options
1.8. 3D Printing Ceramics – Technology Overview
1.9. Evaluation of Ceramic 3D Printing Technologies
1.10. Ceramic 3D printing materials on the market
1.11. Overview of post-processing techniques for metal additive manufacturing
1.12. Overview of post-processing techniques for polymer additive manufacturing
1.13. Relationship between 3D printing hardware and software
1.14. 3D Scanner Manufacturers – Segmented by Price and Technology
1.15. 3D Printing Investment Overview for 2021
1.16. 3D Printing Investment Overview for H1 2022
1.17. Hardware Market Share for Printing Processes by Company
1.18. 3D Printing Technology Segmentation
1.19. 3D Printing Technology Segmentation
1.20. Current market share of materials demand – revenue and mass
1.21. Current AM Technology Market Share
1.22. 3D Printing Market Forecast 2023-2033
1.23. 3D Printing Hardware Market by Technology 2023-2033
1.24. 3D Printing Hardware Market by Technology 2023-2033
1.25. 3D Printing Install Base by Technology 2023-2033
1.26. 3D Printing Technology Market Share in 2033
1.27. 3D Printing Materials Forecast by Material Type – Revenue and Mass
1.28. 3D Printing Materials Forecast by Material Type – Discussion
1.29. Conclusions
1.30. 3D Printing Research at IDTechEx
1.31. Company Profiles – Printer Manufacturers
1.32. Company Profiles – Materials, Software, Services
2. INTRODUCTION
2.1. Glossary: common acronyms for reference
2.2. Scope of Report
2.3. The different types of 3D printing processes
2.4. Material compatibility across 3D printing technologies
2.5. Why adopt 3D printing?
2.6. History of 3D printing: the rise of the hobbyist
2.7. Timeline of 3D printing metals
2.8. History of ceramic 3D printing companies
2.9. Business models: selling printers vs parts
2.10. Consumer vs prosumer vs professional
2.11. Use patterns and market segmentation
2.12. Drivers and restraints of growth for 3D printing
3. POLYMER HARDWARE
3.1. Polymer Printing Technologies
3.1.1. Extrusion: Thermoplastic Filament
3.1.2. Extrusion: Thermoplastic Pellet
3.1.3. Powder Bed Fusion: Selective Laser Sintering (SLS)
3.1.4. Powder Bed Fusion: Multi-Jet Fusion
3.1.5. Vat Photopolymerisation: Stereolithography (SLA)
3.1.6. Vat Photopolymerisation: Digital Light Processing (DLP)
3.1.7. Material Jetting: Photopolymer
3.2. Polymer Printer Benchmarking
3.2.1. Introduction to Polymer 3D Printing Technologies
3.2.2. Benchmarking: Maximum Build Volume
3.2.3. Benchmarking: Build Rate
3.2.4. Benchmarking: Z Resolution
3.2.5. Benchmarking: XY Resolution
3.2.6. Benchmarking: Price vs Build Volume
3.2.7. Benchmarking: Price vs Build Rate
3.2.8. Benchmarking: Price vs Z Resolution
3.2.9. Benchmarking: Build Rate vs Build Volume
3.2.10. Benchmarking: Build Rate vs Z Resolution
3.2.11. Averages of Polymer 3D Printing Technologies
4. POLYMER MATERIALS
4.1. Breaking down polymer materials for 3D printing
4.2. Photopolymer Resins
4.2.1. Introduction to photopolymer resins
4.2.2. Chemistry of photosensitive resins
4.2.3. Chemistry of photopolymer resins
4.2.4. Resins – advantages and disadvantages
4.2.5. General purpose resins – overview
4.2.6. Engineering resins – overview
4.2.7. Flexible resins – overview
4.2.8. Castable resins – overview
4.2.9. Healthcare resins – overview
4.2.10. Extrusion resins – overview
4.2.11. Viscous photosensitive resins
4.2.12. Photosensitive resin suppliers
4.3. Thermoplastic powders
4.3.1. Introduction to thermoplastic powders
4.3.2. Engineering (nylon) powder – overview
4.3.3. Flexible powder – overview
4.3.4. Composite powder – overview
4.3.5. High temperature powder – overview
4.3.6. Engineering (other) powder – overview
4.3.7. Thermoplastic powders: post-processing
4.3.8. Thermoplastic powder suppliers
4.4. Thermoplastic filaments
4.4.1. Introduction to thermoplastic filaments
4.4.2. General purpose filaments – overview
4.4.3. Engineering filaments – overview
4.4.4. Flexible filaments – overview
4.4.5. Reinforced Filaments – overview
4.4.6. High Temperature Filaments – overview
4.4.7. Support Filaments – overview
4.4.8. Fillers for thermoplastic filaments
4.4.9. Thermoplastic filament suppliers
4.4.10. Procurement of thermoplastic filaments
5. METAL HARDWARE
5.1. Established Metal Printing Technologies
5.1.1. Powder Bed Fusion: Direct Metal Laser Sintering (DMLS)
5.1.2. Powder Bed Fusion: Electron Beam Melting (EBM)
5.1.3. Directed Energy Deposition: Powder
5.1.4. Directed Energy Deposition: Wire
5.1.5. Binder Jetting: Metal Binder Jetting
5.1.6. Binder Jetting: Sand Binder Jetting
5.1.7. Sheet Lamination: Ultrasonic Additive Manufacturing (UAM)
5.2. Emerging Metal Printing Technologies
5.2.1. Emerging Printing Processes – overview
5.2.2. Extrusion: Metal-Polymer Filament (MPFE)
5.2.3. Extrusion: Metal-Polymer Pellet
5.2.4. Extrusion: Metal Paste
5.2.5. Vat Photopolymerisation: Digital Light Processing (DLP)
5.2.6. Material Jetting: Nanoparticle Jetting (NPJ)
5.2.7. Material Jetting: Magnetohydrodynamic Deposition
5.2.8. Material Jetting: Electrochemical Deposition
5.2.9. Material Jetting: Cold Spray
5.2.10. Binder Jetting Advancements
5.2.11. Developments in PBF and DED: Energy Sources
5.2.12. Developments in PBF and DED: Low-Cost Printers
5.2.13. Developments in PBF and DED: New Technologies
5.2.14. Processes with a Metal Slurry Feedstock
5.2.15. Alternative Emerging DMLS Variations
5.3. Metal Printers: Comparison and Benchmarking
5.3.1. Metal Additive Manufacturing: Technology Overview
5.3.2. Benchmarking: Maximum Build Volume
5.3.3. Benchmarking: Build Rate
5.3.4. Benchmarking: Z Resolution
5.3.5. Benchmarking: XY Resolution
5.3.6. Benchmarking: Price vs Build Volume
5.3.7. Benchmarking: Price vs Build Rate
5.3.8. Benchmarking: Price vs Z Resolution
5.3.9. Benchmarking: Build Rate vs Build Volume
5.3.10. Benchmarking: Build Rate vs Z Resolution
5.3.11. Overview of Metal 3D Printing Technologies
5.3.12. Maximums & Minimums of Metal 3D Printing Technologies
6. METAL MATERIALS
6.1. Metal powders
6.1.1. Overview of Metal AM Feedstock Options
6.1.2. Powder morphology specification
6.1.3. Water or gas atomization
6.1.4. Plasma atomization
6.1.5. Electrochemical atomization
6.1.6. Powder morphology depends on atomization process
6.1.7. Metal Compatibility with Printing Technologies
6.1.8. Suppliers of metal powders for AM
6.1.9. Titanium powder – overview
6.1.10. Titanium powder – main players
6.1.11. Key material start-ups for metal additive manufacturing
6.1.12. Recycled titanium feedstocks
6.1.13. Metal powder bed fusion post processing
6.1.14. Barriers and limitations to using metal powders
6.2. Other metal feedstocks
6.2.1. Metal wire feedstocks
6.2.2. Metal + polymer filaments
6.2.3. Metal + polymer filaments: BASF Ultrafuse
6.2.4. Metal + photopolymer resin
6.3. Emerging Metal Materials
6.3.1. Expanding the aluminum AM material portfolio
6.3.2. 3D printing with copper: huge potential with many challenges
6.3.3. Expanding the copper AM material portfolio
6.3.4. High entropy alloys for AM
6.3.5. Amorphous alloys for AM
6.3.6. Emerging aluminum alloys and MMCs
6.3.7. Multi-metal material solutions
6.3.8. Materials informatics for additive manufacturing materials
6.3.9. Materials informatics for additive manufacturing materials
6.3.10. Tungsten powder and nanoparticles
7. CERAMIC HARDWARE
7.1. Ceramic Printing Technologies
7.1.1. 3D Printing Ceramics – Technology Overview
7.1.2. Extrusion: Paste
7.1.3. Extrusion: Ceramic-Polymer Filament
7.1.4. Extrusion: Ceramic-Polymer Pellet
7.1.5. Vat Photopolymerisation: Stereolithography (SLA)
7.1.6. Vat Photopolymerisation: Digital Light Processing (DLP)
7.1.7. Material Jetting: Nanoparticle Jetting (NPJ)
7.1.8. Binder Jetting: Ceramic Binder Jetting
7.1.9. Why are there no commercial SLS ceramic printers?
7.1.10. Why are there no commercial SLM ceramic printers?
7.2. Ceramic Printers: Benchmarking
7.2.1. Ceramic: Build Volumes by Printer Manufacturer
7.2.2. Ceramic: Minimum Z Resolution by Printer Manufacturer
7.2.3. Ceramic Benchmarking: Z Resolution vs Build Volume
7.2.4. Ceramic: Minimum XY Resolution by Printer Manufacturer
7.2.5. Ceramic: Build Speed by Technology Type
7.2.6. Ceramic Benchmarking: Build Volume vs Price
7.2.7. Ceramic Benchmarking: Z Resolution vs Price
7.2.8. Evaluation of Ceramic 3D Printing Technologies
8. CERAMIC MATERIALS
8.1. Introduction to ceramic 3D printing materials
8.2. Classification: by feedstock type
8.3. Classification: by application
8.4. Classification: by chemistry
8.5. Ceramic 3D printing materials on the market
8.6. Bioceramics
8.7. Mechanical properties of 3DP ceramic materials
8.8. Thermal properties of 3DP ceramic materials
8.9. Average densities of 3DP ceramic materials
8.10. Flexural strength vs density – 3DP ceramic materials
8.11. Alumina comparison – AM vs non AM
8.12. Zirconia comparison – AM vs non AM
8.13. Silicon carbide and nitride comparison
8.14. Ceramic-matrix composites (CMCs)
8.15. Ceramics as reinforcement in 3D printing
8.16. Manufacturers of ceramics for 3D printing
9. COMPOSITE HARDWARE
9.1. Polymer Composites – Overview
9.2. Chopped Fibre Thermoplastic Filament Extrusion
9.3. Continuous Fibre Thermoplastic Filament Extrusion
9.4. Continuous Fibre Thermoplastic Tape Extrusion
9.5. Sheet Lamination
9.6. Powder Bed Fusion: Selective Laser Sintering (SLS)
9.7. Continuous Fiber Thermoset Extrusion
9.8. Composite Vat Photopolymerization
10. COMPOSITE MATERIALS
10.1. Composite material feedstock: introduction
10.2. Material assessment: matrix considerations
10.3. Material assessment: mechanical properties
10.4. Material assessment: price and performance benchmarking
10.5. Material assessment: price and performance benchmarking
10.6. Complete material list: short carbon fiber
10.7. Complete material list: short glass fiber
10.8. Complete material list: powder
10.9. Complete material list: continuous fiber
10.10. Benchmarking study by independent research institute
10.11. Key composite 3D printing material news and developments
10.12. Recycled carbon fiber as feedstock material
10.13. Nanocarbon additive: property advantages
10.14. Nanocarbon additive: commercial activity
11. PRINTERS AND MATERIALS FOR CONSTRUCTION 3D PRINTING
11.1. A Brief History of Concrete 3D Printing
11.2. The drivers behind 3D printed concrete
11.3. Main categories of concrete AM technology
11.4. Cartesian (“gantry”) extrusion
11.5. Robotic extrusion
11.6. Binder jetting
11.7. Materials for concrete 3D printing
11.8. Notable concrete 3D printing projects
11.9. Barriers to adoption of concrete 3D printing
11.10. Outlook for concrete 3D printing
11.11. Concrete 3D printing companies
11.12. Clay 3D printing for construction
11.13. Thermoset 3D printing for construction
12. POST-PROCESSING FOR ADDITIVE MANUFACTURING
12.1. Introduction to post-processing
12.2. Why is post-processing done after 3D printing?
12.3. Overview of post-processing techniques for metal additive manufacturing
12.4. Overview of post-processing techniques for polymer additive manufacturing
12.5. Material removal
12.6. Process-inherent treatments
12.7. Surface finishing techniques
12.8. Other post-processing treatments
12.9. AM post-processing companies
12.10. Pain points for post-processing in AM
13. SOFTWARE, SCANNERS, AND SERVICES
13.1. Software for 3D Printing
13.1.1. Overview of 3D Printing Software Segments
13.1.2. Relationship between 3D printing hardware and software
13.1.3. Hobbyist 3D printing software usage
13.1.4. Professional 3D printing software usage
13.1.5. 3D Scanning Software
13.1.6. Computer Aided Design (CAD)
13.1.7. .STL files
13.1.8. Computer Aided Engineering (CAE): Topology
13.1.9. Computer Aided Engineering (CAE): Process simulation
13.1.10. Computer Aided Manufacture (CAM): Build preparation
13.1.11. Integrated CAD/CAE/CAM Suites
13.1.12. Workflow Management Solutions
13.1.13. Pain points in 3D printing software
13.1.14. Developers of 3D Printing Software
13.1.15. Developers of 3D Printing Software
13.2. 3D Scanning
13.2.1. Introduction to 3D Scanning
13.2.2. Laser Triangulation
13.2.3. Structured Light
13.2.4. 3D Computed Tomography
13.2.5. Price Segmentation of 3D Scanners
13.2.6. 3D Scanner Manufacturers – Segmented by Price and Technology
13.2.7. 3D Scanners in Additive Manufacturing
13.2.8. Industries using 3D Scanners with 3D Printing
13.3. Production services for 3D printing
13.3.1. What are 3D Printing Service Bureaus?
13.3.2. What Does a Service Bureau Do?
13.3.3. Value Proposition Behind Service Bureaus
13.3.4. Design for Additive Manufacturing (DfAM)
13.3.5. Notable Service Bureaus
13.3.6. Service Bureau Performance During the Pandemic
13.3.7. Challenges Facing Service Bureaus
13.3.8. Outlook for 3D Printing Service Bureaus
13.3.9. List of Selected 3D Printing Service Bureaus
14. APPLICATIONS FOR ADDITIVE MANUFACTURING
14.1. 3D Printing for Healthcare
14.1.1. Most Popular 3D Printing Technologies in Healthcare
14.1.2. Polymers Used in Medical 3D Printing
14.1.3. Medical Applications of Polymer 3D Printing
14.1.4. Medical Applications of 3D Printing by Polymer Type
14.1.5. 3D Printing as a Surgical Tool
14.1.6. Using models to improve patient care, standards and efficiency
14.1.7. 3D Printing Custom Plates, Implants, Valves and Stents
14.1.8. 3D Printing Custom Plates, Implants, Valves and Stents
14.1.9. Case Study: Hip Replacement Revision Surgery
14.1.10. Case Study: Canine Cranial Plate in Titanium
14.1.11. Case Study: Implantable Dental Devices and Prostheses
14.1.12. Case Study: Mandibular Reconstructive Surgery
14.1.13. 3D Printing External Medical Devices
14.1.14. Case Study: Hearing Aids
14.1.15. Case Study: Orthotic Insoles
14.1.16. High temperature thermoplastic filaments and powders
14.1.17. Photosensitive Resins
14.1.18. Titanium Alloy Powders
14.1.19. Bioactive Ceramic Filaments and Resins
14.1.20. 3D-Printing During the COVID-19 Pandemic
14.1.21. Case Study: Parts for Ventilators
14.1.22. 3D Printing in Pharmaceuticals
14.1.23. 3D Printed Pharma: Novel Dissolution Profiles
14.1.24. 3D Printed Pharma: Personalized Medication
14.1.25. 3D Printed Pharma: Novel Drugs and Drug Testing
14.1.26. 3D Printed Pharma: Commercial Status and Regulatory Overview
14.2. 3D Printing in Aviation, Space, and Defense
14.2.1. GE Aviation: LEAP Fuel Nozzles
14.2.2. GE Aviation: Next-Gen RISE Engine
14.2.3. GE Aviation: Bleed Air Parts and Turboprop Engines
14.2.4. GE Aviation and Boeing 777X: GE9X Engines
14.2.5. Boeing 787 Dreamliner: Ti-6Al-4V Structures
14.2.6. Boeing: Gearboxes for Chinook Helicopters
14.2.7. Boeing and Maxar Technologies: Satellites
14.2.8. Airbus and Eutelsat: Satellites
14.2.9. Autodesk and Airbus: Optimised Partition Wall
14.2.10. Airbus: Bracket
14.2.11. RUAG Space and Altair: Antenna Mount
14.2.12. Hofmann: Oxygen Supply Tube
14.2.13. Relativity Space: Rockets
14.2.14. Composite 3D Printing: UAVs and Satellites
14.2.15. OEM AM Strategy – GE
14.2.16. OEM AM Strategy – Airbus
14.2.17. OEM AM Strategy – Boeing
14.2.18. OEM AM Strategy – Rolls-Royce
14.3. Other Industries Using Additive Manufacturing
14.3.1. Automotive
14.3.2. Motorsport
14.3.3. Marine
14.3.4. Oil and Gas
14.3.5. Power Generation
14.3.6. Manufacturing Plants
14.3.7. Consumer Goods
14.3.8. Art and Design
14.3.9. Electronics
15. MARKET ANALYSIS
15.1. Impact of COVID-19: Summary of Company Perspectives
15.2. Fiscal Year 2021 Results: Legacy 3D Printer Manufacturers
15.3. Fiscal Year 2021 Results: Emerging Printer Manufacturers
15.4. Fiscal Year 2021 Results: Metal Printer Manufacturers
15.5. Fiscal Year 2021 Results: Service Providers
15.6. 3D Printing Investment Overview for 2021
15.7. Notable Acquisitions in 2021
15.8. Acquisition Spotlight: Desktop Metal
15.9. Companies That Went Public in 2021: Summary
15.10. Companies Going Public in 2021 by Company Type
15.11. Printer Companies Going Public in 2021 by Material
15.12. Companies Going Public in 2021: SPAC vs IPO
15.13. Companies Going Public in 2021 by Country
15.14. 3D Printing Private Funding in 2021 by Company Type
15.15. 3D Printing Private Funding in 2021 by Region
15.16. 3D Printing Private Funding in 2021 by Country
15.17. Top 10 Fundraising Rounds in 2021
15.18. 3D Printing Investment Overview for H1 2022
15.19. Notable Acquisitions/Mergers in H1 2022
15.20. Companies Going Public in H1 2022
15.21. 3D Printing Investment in H1 2022
15.22. 3D Printing Hardware Historic Revenue Growth
15.23. Evolution of Market Shares for 7 Printing Processes
15.24. Hardware Market Share by Company
15.25. Hardware Market Share for Printing Processes by Company
15.26. 3D Printing Hardware Revenue by Manufacturer Region
15.27. Technology Segmentation
15.28. Technology Segmentation
15.29. Current Technology Market Share
15.30. Current market share of materials demand – revenue and mass
16. MARKET FORECASTS
16.1. 3D Printing Market Forecast 2023-2033
16.2. 3D Printing Hardware Forecasts
16.2.1. Forecast Methodology and Presentation of Findings
16.2.2. 3D Printing Hardware Market Forecast
16.2.3. 3D Printing Hardware Market by Technology
16.2.4. 3D Printing Hardware Market by Process
16.2.5. 3D Printing Hardware Market by Material Class
16.2.6. 3D Printing Hardware Market by Unit Sale Type
16.2.7. 3D Printing Hardware Unit Sales by Technology
16.2.8. 3D Printing Install Base by Technology
16.2.9. 3D Printing Technology Market Share in 2033
16.3. 3D Printing Material Forecasts
16.3.1. Forecast methodology and presentation of findings
16.3.2. 3D Printing Materials Forecast by Material Type – Revenue and Mass
16.3.3. 3D Printing Materials Forecast by Material Type – Discussion
16.3.4. Polymer AM Materials Forecast by Feedstock – Revenue and Mass
16.3.5. Polymer Materials Forecast by Feedstock – Discussion
16.3.6. Metal AM Materials Forecast by Feedstock – Revenue and Mass
16.3.7. Metal AM Materials Forecast by Feedstock – Discussion
17. CONCLUSIONS
17.1. Key Trends for 3D Printing Materials
17.2. Key Trends in Metal Additive Manufacturing
17.3. Key Trends in Metal Additive Manufacturing
17.4. Conclusions
17.5. Company Profiles – Printer Manufacturers
17.6. Company Profiles – Materials, Software, Services
17.7. 3D Printing Research at IDTechEx
18. APPENDIX
18.1. 3D Printing Market Forecast 2023-2033
18.2. 3D Printing Hardware Market by Technology
18.3. 3D Printing Hardware Market by Material Class
18.4. 3D Printing Hardware Market by Unit Sale Type
18.5. 3D Printing Hardware Unit Sales by Technology
18.6. 3D Printing Install Base by Technology
18.7. 3D Printing Materials Forecast by Material Type – Mass
18.8. 3D Printing Materials Forecast by Material Type – Revenue
18.9. Polymer AM Materials Forecast by Feedstock – Revenue
18.10. Polymer AM Materials Forecast by Feedstock – Mass
18.11. Metal AM Materials Forecast by Feedstock – Mass
18.12. Metal AM Materials Forecast by Feedstock – Revenue

Methodology

Research Methodology is the process used to collect information and data for the purpose of making business decisions. The success of a research project is entirely dependent on the research methodology adopted by the company. Research Methodology and Scope We have implemented a mix of primary and secondary research for our market estimate and forecast. Secondary research formed the initial phase of our study, where we conducted extensive data mining, referring to verified data sources such as independent studies, company annual reports, white papers, case studies, government and regulatory published articles, technical journals, magazines, and paid data sources. It was also used to obtain important information about the key players and market classification & segmentation according to industry trends to the bottom-most level, and key developments related to market and technology perspectives. A database of the key industry leaders was also prepared using secondary research.

In the primary research process, various primary sources from both supply and demand sides have been interviewed to obtain qualitative and quantitative information important for respective regions. The primary sources from the supply side included industry experts such as CEOs, VPs, marketing directors, technology and innovation directors, and related executives from key companies and organizations operating in the respective regions. The primary data has been collected through questionnaires, e-mails, and telephonic interviews, end-user surveys, consumer surveys, technology distributors and wholesaler’s surveys.

  • Quantitative methods (e.g. surveys) are best for measuring, ranking, categorizing, identifying patterns and making generalizations
  • Qualitative methods (e.g. interviews) are best for describing, interpreting, contextualizing, and gaining in-depth insight into specific concepts or phenomena
  • Mixed methods allow for a combination of numerical measurement and in-depth exploration.

Market drivers and restraints, along with their current and expected impacts, technological scenario and expected developments, end-use industry trends and dynamics  and consumer behavior trends  these forecasting parameters were considered.

Ethical approach, attention to detail, consistency, latest trend in the market and highly authentic source these are benefits of company’s research methodology.

Global Industry Reports

Market size estimation methodology top-down and bottom-up approaches

Both top-down and bottom-up approaches have been used to estimate and validate the total size of the virtual reality market. These methods have also been extensively used to estimate the sizes of various market subsegments. Estimating the size of the market in each region by adding the sizes of country-wise markets and tracking the ongoing and upcoming implementation of virtual reality projects by various companies in each region and forecasting the size of the virtual reality market based on these developments and other critical parameters, including COVID-19 related impacts

Data Triangulation

After arriving at the overall market size—using the market size estimation processes explained above—the market has been split into several segments and subsegments. To complete the overall market engineering process and arrive at the exact statistics of each market segment and subsegment, data triangulation, and market breakdown procedures have been employed, wherever applicable. The data has been triangulated by studying various factors and trends from both the demand and supply sides. It provide detailed information regarding the major factors (drivers, restraints, opportunities, challenges, company profiles, key player strategies competitive developments and key developments) influencing the virtual reality market growth.

Statistical Model

Our market estimates and forecasts are derived through simulation models. A unique model is created customized for each study. Gathered information for market dynamics, technology landscape, application development and pricing trends is fed into the model and analyzed simultaneously. These factors are studied on a comparative basis, and their impact over the forecast period is quantified with the help of correlation, regression and time series analysis.