

Report Overview
- Understand the latest market trends and future growth opportunities for the Geosynthetics industry globally with research from the Global Industry Reports team of in-country analysts – experts by industry and geographic specialization.
- Key trends are clearly and succinctly summarized alongside the most current research data available. Understand and assess competitive threats and plan corporate strategy with our qualitative analysis, insight, and confident growth projections.
- The report will cover the overall analysis and insights in relation to the size and growth rate of the “Geosynthetics Market” by various segments at a global and regional level for the 2010-2030 period, with 2010-2021 as historical data, 2022 as a base year, 2023 as an estimated year and 2023-2030 as forecast period.
Description:
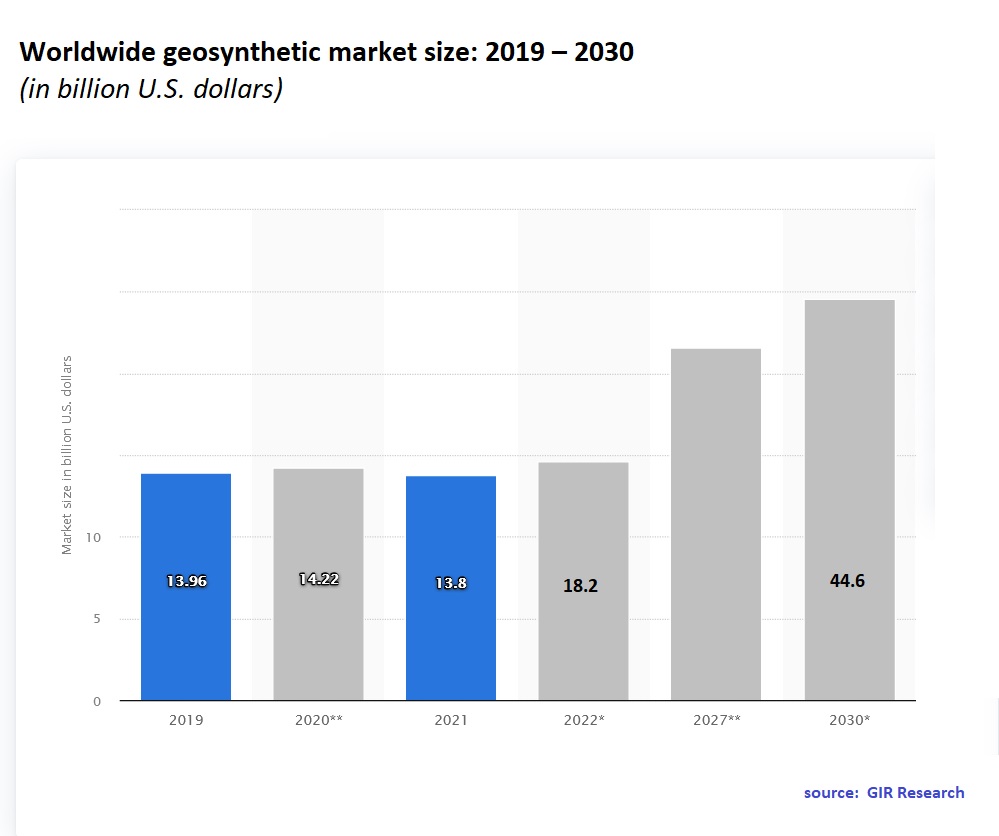
- In the changed post COVID-19 business landscape, the global market for Geosynthetics estimated at US$18.2 Billion in the year 2022, is projected to reach a revised size of US$44.6 Billion by 2030, growing at a CAGR of 11.8% over the period 2022-2030.
- Geotextiles, one of the segments analyzed in the report, is projected to record 10.9% CAGR and reach US$19.8 Billion by the end of the analysis period. Taking into account the ongoing post pandemic recovery, growth in the Geomembranes segment is readjusted to a revised 12.5% CAGR for the next 8-year period.
- The Geosynthetics market in the U.S. is estimated at US$5 Billion in the year 2022. China, the world`s second largest economy, is forecast to reach a projected market size of US$10.2 Billion by the year 2030 trailing a CAGR of 16.2% over the analysis period 2022 to 2030. Among the other noteworthy geographic markets are Japan and Canada, each forecast to grow at 7.4% and 9.9% respectively over the 2022-2030 period. Within Europe, Germany is forecast to grow at approximately 8.8% CAGR.
MARKET DATA INCLUDED
- Unit Sales, Average Selling Prices, Market Size & Growth Trends
- COVID-19 Impact and Global Recession Analysis
- Analysis of US inflation reduction act 2022
- Global competitiveness and key competitor percentage market shares
- Market presence across multiple geographies – Strong/Active/Niche/Trivial
- Online interactive peer-to-peer collaborative bespoke updates
- Market Drivers & Limiters
- Market Forecasts Until 2030, and Historical Data up to 2015
- Recent Mergers & Acquisitions
- Company Profiles and Product Portfolios
- Leading Competitors
The Report Includes:
- The report provides a deep dive into details of the industry including definitions, classifications, and industry chain structure.
- Analysis of key supply-side and demand trends.
- Detailed segmentation of international and local products.
- Historic volume and value sizes, company, and brand market shares.
- Five-year forecasts of market trends and market growth.
- Robust and transparent research methodology conducted in-country.
- Qualitative and quantitative analysis of the market based on segmentation involving both economic as well as non-economic factors.
- Provision of market value (USD Billion) data for each segment and sub-segment.
- Analysis by geography, region, Country, and its states.
- A brief overview of the commercial potential of products, technologies, and applications.
- Company profiles of leading market participants dealing in products category.
- Description of properties and manufacturing processes.
- marketed segments on the basis of type, application, end users, region, and others.
- Discussion of the current state, setbacks, innovations, and future needs of the market.
- Examination of the market by application and by product sizes; utility-scale, medium scale and small-scale.
- Country-specific data and analysis for the United States, Russia, China, Germany, United Kingdom, France, Japan, Israel, Saudi Arabia, South Korea, United Arab Emirates, Canada, Switzerland, Australia, India, Italy, Turkey, Qatar, Sweden, Spain, Belgium, Netherlands, Norway, Singapore, Egypt, Denmark, Austria, Vietnam, Brazil, Argentina, Mexico, South Africa, and others.
- Coverage of historical overview, key industrial development and regulatory framework.
- Analysis of competitive developments, such as contracts & agreements, expansions, new product developments, and mergers & acquisitions in the market.
- A look at the opportunities in the market for stakeholders and provide a competitive landscape of the market leaders.
Reports Scope and Segments:
| Report Attribute | Details |
| Market size in 2022 | USD 18.2 Billion USD |
| Market forecast in 2030 | USD 44.6 Billion USD |
| Growth Rate | CAGR of 11.8% from 2023 to 2030 |
| Base year for estimation | 2022 |
| Historical data | 2015 – 2022 |
| Forecast period | 2023 – 2030 |
| Quantitative units | Revenue in USD million and CAGR from 2023 to 2030 |
| Report coverage | Revenue forecast, company ranking, competitive landscape, growth factors, trends, DROT Analysis, Market Dynamics and Challenges, and Strategic Growth Initiatives
COVID-19 Impact, Market Growth Trends, Market Limiters, Competitive Analysis & SWOT for Top Competitors, Mergers & Acquisitions, Company Profiles, Product Portfolios, Disease Overviews. Market Size, Market Shares, Market Forecasts, Market Growth Rates, Units Sold, and Average Selling Prices. |
| Segments covered | Type, Technology, Material, Application, End Use & Region |
| Regional scope | North America; Europe; Asia Pacific; Latin America; Middle East and Africa and rest of the world |
| Country scope | United States, Russia, China, Germany, United Kingdom, France, Japan, Israel, Saudi Arabia, South Korea, United Arab Emirates, Canada, Switzerland, Australia, India, Italy, Turkey, Qatar, Sweden, Spain, Belgium, Netherlands, Norway, Singapore, Egypt, Denmark, Austria, Vietnam, Brazil, Argentina, Mexico, South Africa, and others. |
| Key companies profiled | AGRU America, Inc.; Berry Global, Inc.; Carthage Mills, Inc.; CETCO; Contech Engineered Solutions LLC; Cooley Group; CTM Geosynthetics; EPI Environmental Products Inc.; Fabrene Inc.; Fibertex Nonwovens A/S; Fibromat (M) Sdn Bhd.; Freudenberg Group; Garware Technical Fibres Ltd.; Glen Raven Inc.; Global Synthetics; GSE Environmental, Inc.; Hanes Geo Components; HUESKER Group; Koninklijke Ten Cate N.V.; Layfield Group; Leggett & Platt; Leister Technologies LLC; Low & Bonar PLC; Maccaferri, Inc.; Maharshee Geomembrane (India) Pvt. Ltd.; Mattex Geosynthetics; NAUE GmbH & Co. KG; Nilex Inc.; Owens Corning; PGI Nonwovens; Pietrucha Group; Plastatech Engineering Ltd.; Propex Operating Company LLC; PRS Geo-Technologies; Raven Industries, Inc.; Schouw & Co.; SKAPS Industries; Solmax; Steklonit; Strata Systems, Inc.; Swicofil AG; Techno Fabrics Geosynthetics Pvt. Ltd.; Tenax Corporation; TenCate Geosynthetics Americas; Tensar International Corporation, Inc.; Terrafix Geosynthetics Inc.; Terram Geosynthetics Pvt. Ltd. (TGPL); Texel; Thrace Group; Titan Environmental Containment; Tuflex India; Typar Geosynthetics; Western Environmental Liner; Zhejiang Chengmei Import & Export Co., Ltd. and others |
| Customization scope | Free report customization (equivalent up to 20 analyst’s working days) with purchase. Addition or alteration to country, regional & segment scope. |
| Report Format | PDF, PPT, Excel & Online User Account |
Report Segmented by:
| Based On Product Type | Based On Application | Based On Region |
| Geotextiles | Water/wastewater Management | North America |
| Geomembranes | Civil Construction and Mining | Europe |
| Geogrids | Roads & Infrastructure | Asia Pacific |
| Geocomposites | Ecological | Middle East & Africa |
| Geonets | Energy | Latin America |
| Geofoam | Agriculture | Rest of the World |
| Others | Others |
Companies Covered in Report:
| AGRU America, Inc. | Nilex Inc. |
| Berry Global, Inc. | Owens Corning |
| Carthage Mills, Inc. | PGI Nonwovens |
| CETCO | Pietrucha Group |
| Contech Engineered Solutions LLC | Plastatech Engineering Ltd. |
| Cooley Group | Propex Operating Company LLC |
| CTM Geosynthetics | PRS Geo-Technologies |
| EPI Environmental Products Inc. | Raven Industries, Inc. |
| Fabrene Inc. | Schouw & Co. |
| Fibertex Nonwovens A/S | SKAPS Industries |
| Fibromat (M) Sdn Bhd. | Solmax |
| Freudenberg Group | Steklonit |
| Garware Technical Fibres Ltd. | Strata Systems, Inc. |
| Glen Raven Inc. | Swicofil AG |
| Global Synthetics | Techno Fabrics Geosynthetics Pvt. Ltd. |
| GSE Environmental, Inc. | Tenax Corporation |
| Hanes Geo Components | TenCate Geosynthetics Americas |
| HUESKER Group | Tensar International Corporation, Inc. |
| Koninklijke Ten Cate N.V. | Terrafix Geosynthetics Inc. |
| Layfield Group | Terram Geosynthetics Pvt. Ltd. (TGPL) |
| Leggett & Platt | Texel |
| Leister Technologies LLC | Thrace Group |
| Low & Bonar PLC | Titan Environmental Containment |
| Maccaferri, Inc. | Tuflex India |
| Maharshee Geomembrane (India) Pvt. Ltd. | Typar Geosynthetics |
| Mattex Geosynthetics | Western Environmental Liner |
| NAUE GmbH & Co. KG | Zhejiang Chengmei Import & Export Co., Ltd. |
After Sales Support
- Every updated edition of the report and full data stack will be provided at no extra cost for 24 months.
- Latest 2022 base year report.
- Free Updated edition of 2023 every quarter without any hidden cost.
- No user limitation for the report. Unlimited access within the organization.
- Unrestricted post-sales support at no additional cost
- Free report customization (equivalent up to 10 analyst’s working days) with purchase. Addition or alteration to country, regional & segment scope
- Global Industry Reports will support your post-purchase for a period of 24 months to answer any of your queries related to the following market and to provide you any more data needed, for your analysis.
- Option to purchase regional or some selected Chapters from the report.
Key questions that are answered in this report
- What is the total market of Geosynthetics in 2023?
- What is the total CAGR expected to be recorded for the Geosynthetics market during 2022-2030?
- What are the driving factors for the Geosynthetics market?
- Which are the significant players operating in the Geosynthetics market?
- Which region will grow at a fast rate in the future?
- How big is the Geosynthetics market?
- What are the Challenges in Geosynthetics market?
- What is the Restraint in Geosynthetics market?
- What Company Leading the North America Geosynthetics market?
- What are Opportunities in Geosynthetics market?
- Which Region is largest share of Market in Asia pacific?