
Report Overview
- Understand the latest market trends and future growth opportunities for the Green Building Materials industry globally with research from the Global Industry Reports team of in-country analysts – experts by industry and geographic specialization.
- Key trends are clearly and succinctly summarized alongside the most current research data available. Understand and assess competitive threats and plan corporate strategy with our qualitative analysis, insight, and confident growth projections.
- The report will cover the overall analysis and insights in relation to the size and growth rate of the “Green Building Materials Market” by various segments at a global and regional level for the 2010-2030 period, with 2010-2021 as historical data, 2022 as a base year, 2023 as an estimated year and 2023-2030 as forecast period.
Description:
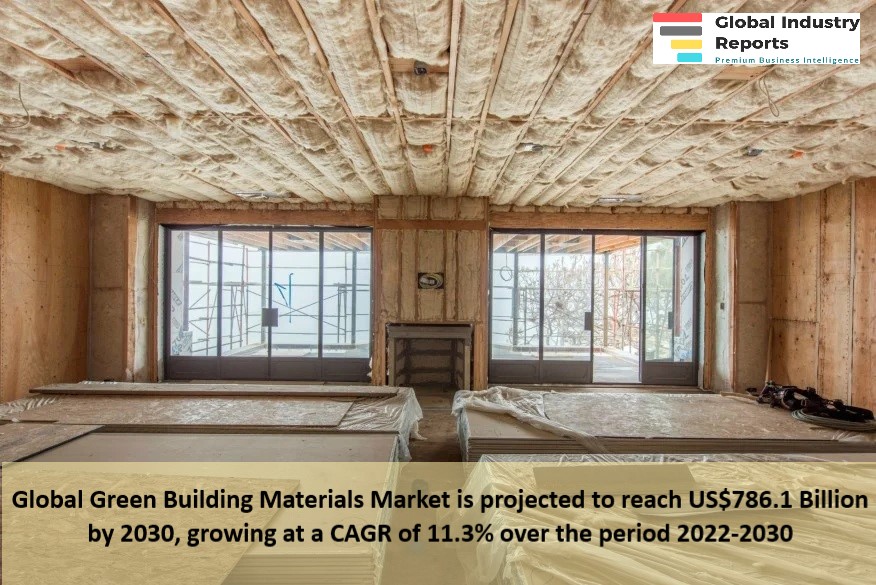
- The global market for Green Building Materials estimated at US$334.9 Billion in the year 2022, is projected to reach a revised size of US$786.1 Billion by 2030, growing at a CAGR of 11.3% over the period 2022-2030.
- Structural, one of the segments analyzed in the report, is projected to record 12.2% CAGR and reach US$564.4 Billion by the end of the analysis period. Growth in the Interior segment is estimated at 9.9% CAGR for the next 8-year period.
- The Green Building Materials market in the U.S. is estimated at US$91.2 Billion in the year 2022. China, the world`s second largest economy, is forecast to reach a projected market size of US$201.4 Billion by the year 2030 trailing a CAGR of 17.3% over the analysis period 2022 to 2030. Among the other noteworthy geographic markets are Japan and Canada, each forecast to grow at 5.8% and 9.9% respectively over the 2022-2030 period. Within Europe, Germany is forecast to grow at approximately 7.2% CAGR.
MARKET DATA INCLUDED
- Unit Sales, Average Selling Prices, Market Size & Growth Trends
- COVID-19 Impact and Global Slowdown Analysis
- Analysis of US inflation reduction act 2022
- Global competitiveness and key competitor percentage market shares
- Market presence across multiple geographies – Strong/Active/Niche/Trivial
- Online interactive peer-to-peer collaborative bespoke updates
- Market Drivers & Limiters
- Market Forecasts Until 2030, and Historical Data up to 2015
- Recent Mergers & Acquisitions
- Company Profiles and Product Portfolios
- Leading Competitors
The Report Includes:
- In-depth exploration of the industry, encompassing definitions, classifications, and the industry’s interconnected structure.
- Examination of pivotal supply-side and demand trends.
- Detailed breakdown of both international and local products.
- Insight into historical volume and value dimensions, along with market shares of companies and brands.
- Five-year predictions regarding market trends and growth.
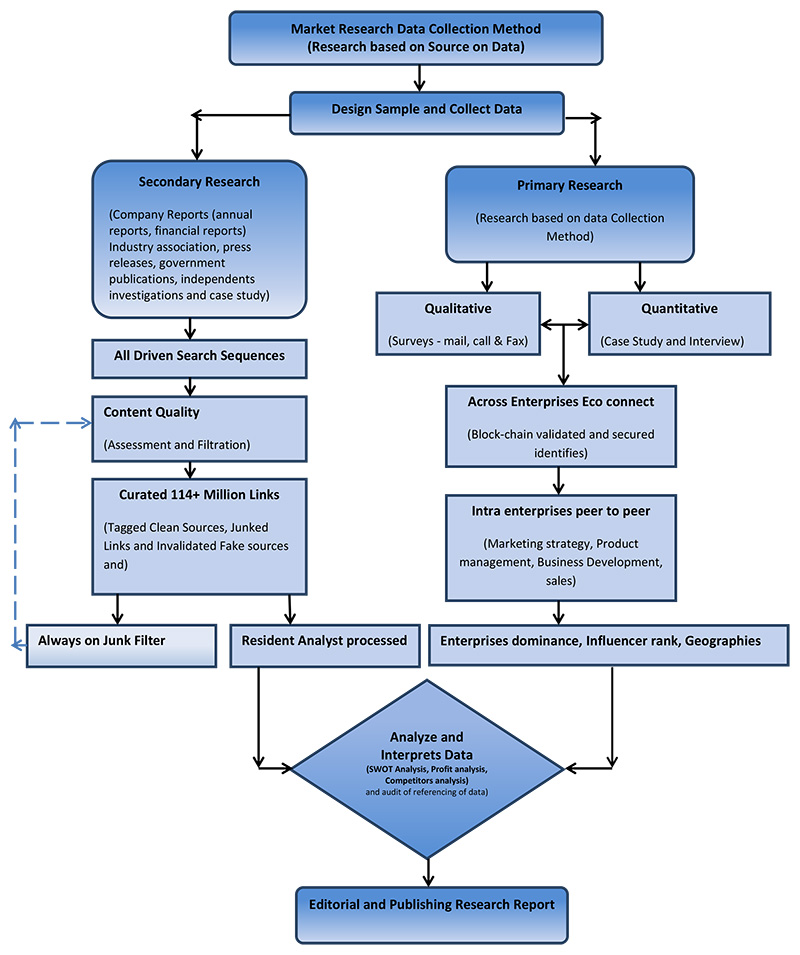
- A robust and transparent research methodology conducted within the country.
- A blend of qualitative and quantitative analysis, grounded in segmentation that considers economic and non-economic aspects.
- Provision of market value data (in USD Billion) for every segment and sub-segment.
- Geographical, regional, national, and state-wise analysis.
- A succinct overview of the commercial potential inherent in products, technologies, and applications.
- Company profiles of key market players operating within the product category.
- Descriptions of attributes and manufacturing processes.
- Segmentation based on type, application, end-users, regions, and other factors.
- Discussion about the current state, challenges, innovations, and future requirements of the market.
- Examination of the market based on application and product sizes: utility-scale, medium scale, and small-scale.
- Country-specific insights and analyses for major countries and regions.
- Coverage of historical context, pivotal industrial developments, and regulatory frameworks.
- Analysis of competitive movements, including agreements, expansions, new products, and mergers & acquisitions.
- Exploration of opportunities for stakeholders and a depiction of the competitive landscape among market leaders.
- Specialized coverage of significant global events, such as the Russia-Ukraine war, global inflation, China’s “zero-Covid” policy shift, supply chain disruptions, trade tensions, and the risk of recession.
- Evaluation of global competitiveness and market shares among key competitors.
- Presence assessment across various geographical markets: Strong, Active, Niche, Trivial.
- Online, interactive, peer-to-peer collaborative updates.
- Access to digital archives and the Market Research Platform.
- Complimentary updates for a two-year period.
Green Building Materials Reports Scope and Segments:
| Report Attribute | Details |
| Market size value in 2022 | USD 334.9 Billion |
| Revenue forecast in 2030 | USD 786.1 Billion |
| Growth Rate | CAGR of 11.3% from 2022 to 2030 |
| Base year for estimation | 2022 |
| Historical data | 2015 – 2022 |
| Forecast period | 2023 – 2030 |
| Quantitative units | Revenue in USD million and CAGR from 2023 to 2030 |
| Report coverage | Revenue forecast, company ranking, competitive landscape, growth factors, trends, DROT Analysis, Market Dynamics and Challenges, and Strategic Growth Initiatives
COVID-19 Impact, Market Growth Trends, Market Limiters, Competitive Analysis & SWOT for Top Competitors, Mergers & Acquisitions, Company Profiles, Product Portfolios Market Size, Market Shares, Market Forecasts, Market Growth Rates, Units Sold, and Average Selling Prices. |
| Segments covered | Product, Type, Platform, Application & Region |
| Regional scope | North America; Europe; Asia Pacific; Latin America; Middle East and Africa and rest of the world |
| Country scope | United States, China, Japan, Germany, India, United Kingdom, France, Brazil, Italy, Canada, South Korea, Australia, Russia, Spain, Mexico, Indonesia, Netherlands, Switzerland, Saudi Arabia, Turkey, Taiwan, Poland, Sweden, Belgium, Thailand, Austria, Nigeria, Argentina, United Arab Emirates, Iran, Norway, Israel, Ireland, Malaysia, Denmark, Singapore, Philippines, Pakistan, Finland, Chile, Vietnam, Greece, Czech Republic, Romania, Portugal, Peru, New Zealand, Hungary, Iraq, Bangladesh, Qatar, Kuwait, Ukraine, Egypt, Kazakhstan, Colombia, Angola, Algeria, Morocco, Slovakia, Oman, Puerto Rico, Ethiopia, Sudan, Kenya, Ghana, Dominican Republic, Myanmar, Tanzania, Ecuador, Belarus, Guatemala, Lithuania, Latvia, Sri Lanka, Nepal, Lebanon, Slovenia, Bahrain, Libya and others |
| Key companies profiled | ACC Limited; Actividades de Construccion y Servicios SA; Alumasc Group Plc; Ambuja Cements Ltd; American Hydrotech, Inc.; Amvic Inc.; Amvik Systems; Andersen Corporation; Anhui Conch Cement Company Limited; Armstrong World Industries; BASF SE; Bauder Ltd.; BBMG Corporation; Binderholz GmbH; Boral Limited; BYD Company Limited; Cemex USA; CertainTeed Corporation; Chengdu Onekin Green Building Materials Co. Ltd; China National Building Material Company (CNBM); China National Materials Group Corporation (Sinoma); China Resources Cement Holdings Limited; China State Construction Engineering Corp Ltd; China Zhongwang Holdings Limited; Dow Inc.; DuPont de Nemours Inc; Eagle Roofing Products; Ecolab Inc.; Everest Industries Ltd; Firestone Building Products Company, LLC; Fletcher Insulation Pty Limited; Fluor Corporation; Forbo Holding Ltd; GAF Materials Corporation; Georgia-Pacific LLC; Gree Electric Appliances Inc.; Greenply Industries Ltd; HeidelbergCement AG; HIL Ltd; Holcim Ltd.; Homasote Company; Interface Inc.; James Hardie Industries; Johns Manville; Johnson Controls; JSW Cement Ltd; Kajaria Ceramics Ltd; Kingspan Group Plc; Knauf Insulation Ltd.; Lafarge Company; Laticrete International; LG Hausys, Ltd.; LIXIL Group Corporation; Masco Corporation; Mohawk Industries; National Fiber; Nexii Building Solutions Inc.; Norbord Inc.; Orient Bell Limited; Owens Corning; PPG Industries, Inc.; RedBuilt LLC; Reward Wall Systems; Rockwool International A/S; Saint-Gobain; Schneider Electric; Schüco International KG; Siemens AG; Sika AG; Skanska AB; Soben International Ltd; Sobha Limited; Standard Industries Inc.; Steico SE; Structurlam Products Ltd.; Tarkett Group; The Walsh Group; Tutor Perini Corp; UltraTech Cement Ltd; US GreenFiber; USG Corporation; Uzin Utz AG; Vaillant Group; VELUX Group; Vinci SA; Wienerberger AG; Xinyi Glass Holdings Limited; Xtratherm Limited and others |
| Customization scope | Free report customization (equivalent up to 20 analyst’s working days) with purchase. Addition or alteration to country, regional & segment scope. |
| Report Format | PDF, PPT, Excel & Online User Account |
Green building materials market report segmented by:
Green Building Materials Market, By Product:
- Structural
- Interior
- Exterior
- Others
Green Building Materials Market, By Use:
- Residential
- Commercial
- Infrastructure
- Institution & offices
- Industrial
Green Building Materials Market by Application:
- Exterior siding
- Interior Finishing
- Insulation
- Framing
- Roofing
- Others
Green Building Materials Market By, Region:
- North America
- Europe
- Asia Pacific
- South America
- Middle East & Africa
- Rest of the World
Companies covered in green building materials market Report:
| ACC Limited | JSW Cement Ltd |
| Actividades de Construccion y Servicios SA | Kajaria Ceramics Ltd |
| Alumasc Group Plc | Kingspan Group Plc |
| Ambuja Cements Ltd | Knauf Insulation Ltd. |
| American Hydrotech, Inc. | Lafarge Company |
| Amvic Inc. | Laticrete International |
| Amvik Systems | LG Hausys, Ltd. |
| Andersen Corporation | LIXIL Group Corporation |
| Anhui Conch Cement Company Limited | Masco Corporation |
| Armstrong World Industries | Mohawk Industries |
| BASF SE | National Fiber |
| Bauder Ltd. | Nexii Building Solutions Inc. |
| BBMG Corporation | Norbord Inc. |
| Binderholz GmbH | Orient Bell Limited |
| Boral Limited | Owens Corning |
| BYD Company Limited | PPG Industries, Inc. |
| Cemex USA | RedBuilt LLC |
| CertainTeed Corporation | Reward Wall Systems |
| Chengdu Onekin Green Building Materials Co. Ltd | Rockwool International A/S |
| China National Building Material Company (CNBM) | Saint-Gobain |
| China National Materials Group Corporation (Sinoma) | Schneider Electric |
| China Resources Cement Holdings Limited | Schüco International KG |
| China State Construction Engineering Corp Ltd | Siemens AG |
| China Zhongwang Holdings Limited | Sika AG |
| Dow Inc. | Skanska AB |
| DuPont de Nemours Inc | Soben International Ltd |
| Eagle Roofing Products | Sobha Limited |
| Ecolab Inc. | Standard Industries Inc. |
| Everest Industries Ltd | Steico SE |
| Firestone Building Products Company, LLC | Structurlam Products Ltd. |
| Fletcher Insulation Pty Limited | Tarkett Group |
| Fluor Corporation | The Walsh Group |
| Forbo Holding Ltd | Tutor Perini Corp |
| GAF Materials Corporation | UltraTech Cement Ltd |
| Georgia-Pacific LLC | US GreenFiber |
| Gree Electric Appliances Inc. | USG Corporation |
| Greenply Industries Ltd | Uzin Utz AG |
| HeidelbergCement AG | Vaillant Group |
| HIL Ltd | VELUX Group |
| Holcim Ltd. | Vinci SA |
| Homasote Company | Wienerberger AG |
| Interface Inc. | Xinyi Glass Holdings Limited |
| James Hardie Industries | Xtratherm Limited |
| Johns Manville | Others |
| Johnson Controls |
After Sales Support
- Every updated edition of the report and full data stack will be provided at no extra cost for 24 months.
- Latest 2022 base year report.
- Free Updated edition of 2023 every quarter without any hidden cost.
- No user limitation for the report. Unlimited access within the organization.
- Unrestricted post-sales support at no additional cost
- Free report customization (equivalent up to 10 analyst’s working days) with purchase. Addition or alteration to country, regional & segment scope
- Global Industry Reports will support your post-purchase for a period of 24 months to answer any of your queries related to the following market and to provide you any more data needed, for your analysis.
- Option to purchase regional or some selected Chapters from the report.
Key questions that are answered in this report
- What is the total market of Green building materials in 2023?
- What is the total CAGR expected to be recorded for the Green building materials market during 2022-2030?
- What are the driving factors for the Green building materials market?
- Which are the significant players operating in the Green building materials market?
- Which region will grow at a fast rate in the future in Green building materials market?
- How big is the Green building materials Market?
- What are the Challenges in Green building materials Market?
- What is the Restraint in Green building materials Market?
- What Company Leading the North America Green building materials Market?
- What are Opportunities in Green building materials Market?
- Which Region is largest share of Green building materials Market in Asia Specific?