
Report Overview
- Understand the latest market trends and future growth opportunities for the Smart Augmented Reality (AR) Glasses industry globally with research from the Global Industry Reports team of in-country analysts – experts by industry and geographic specialization.
- Key trends are clearly and succinctly summarized alongside the most current research data available. Understand and assess competitive threats and plan corporate strategy with our qualitative analysis, insight, and confident growth projections.
- The report will cover the overall analysis and insights in relation to the size and growth rate of the “Smart Augmented Reality (AR) Glasses Market” by various segments at a global and regional level for the 2010-2030 period, with 2010-2021 as historical data, 2022 as a base year, 2023 as an estimated year and 2023-2030 as forecast period.
Description:
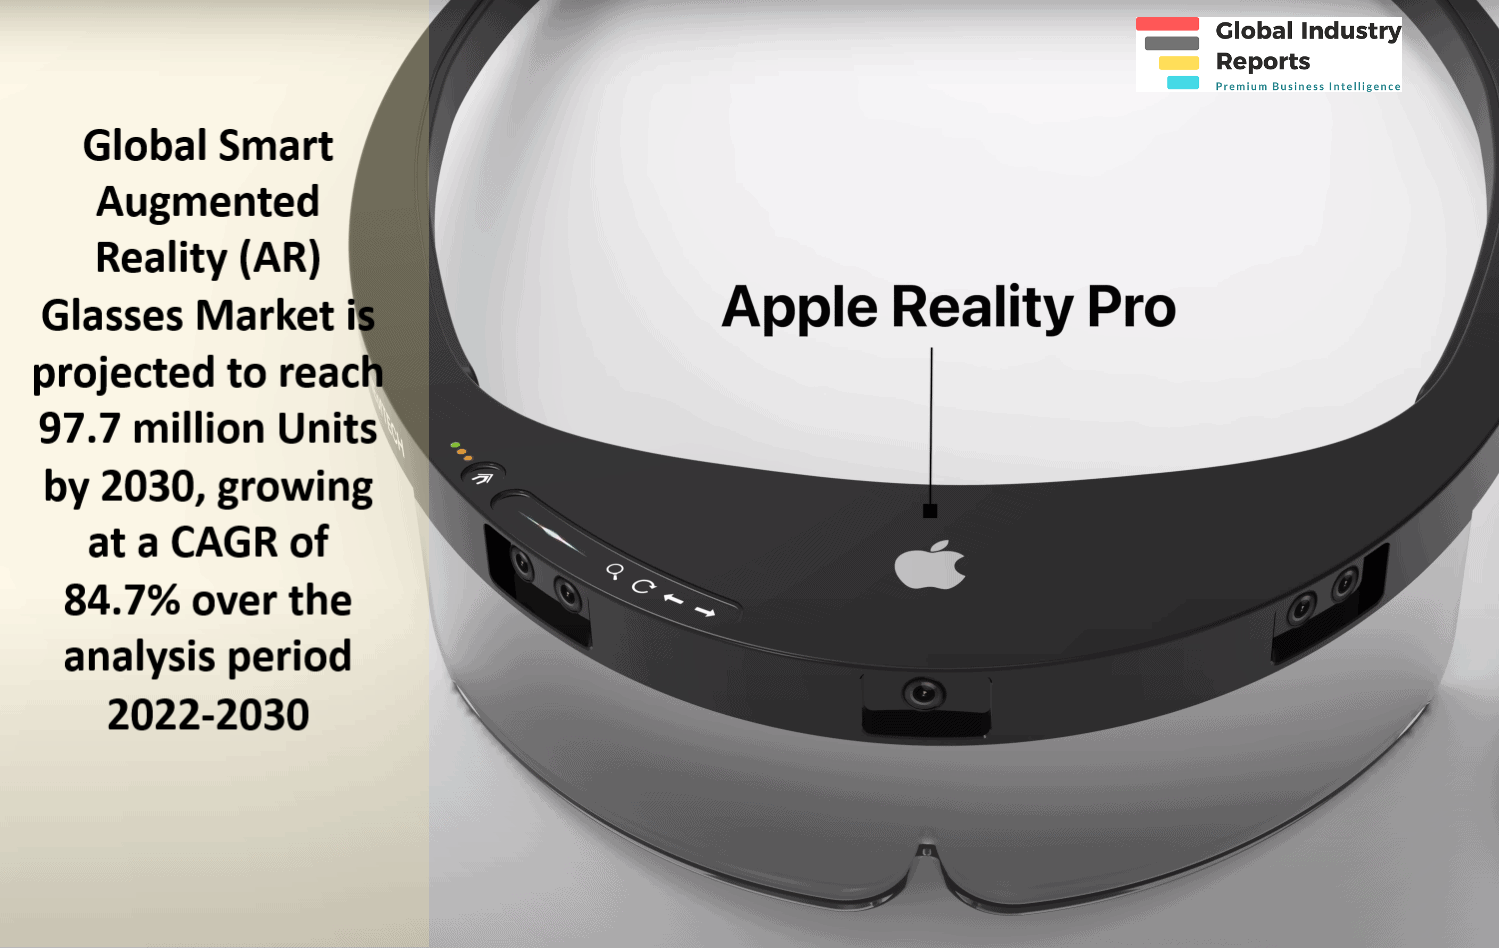
- In the changed post COVID-19 business landscape, the global market for Smart Augmented Reality (AR) Glasses estimated at 721 thousand Units in the year 2022, is projected to reach a revised size of 97.7 million Units by 2030, growing at a CAGR of 84.7% over the analysis period 2022-2030.
- Simple Assisted Reality Glasses, one of the segments analyzed in the report, is projected to record a 80.4% CAGR and reach 36.4 Million Units by the end of the analysis period. Taking into account the ongoing post pandemic recovery, growth in the MR Holographic Displays segment is readjusted to a revised 92.8% CAGR for the next 8-year period.
- The Smart Augmented Reality (AR) Glasses market in the U.S. is estimated at 448.8 thousand Units in the year 2022. China, the world`s second largest economy, is forecast to reach a projected market size of 7.5 million Units by the year 2030 trailing a CAGR of 104% over the analysis period 2022 to 2030. Among the other noteworthy geographic markets are Japan and Canada, each forecast to grow at 73.9% and 79.9% respectively over the 2022-2030 period. Within Europe, Germany is forecast to grow at approximately 85.2% CAGR.
MARKET DATA INCLUDED
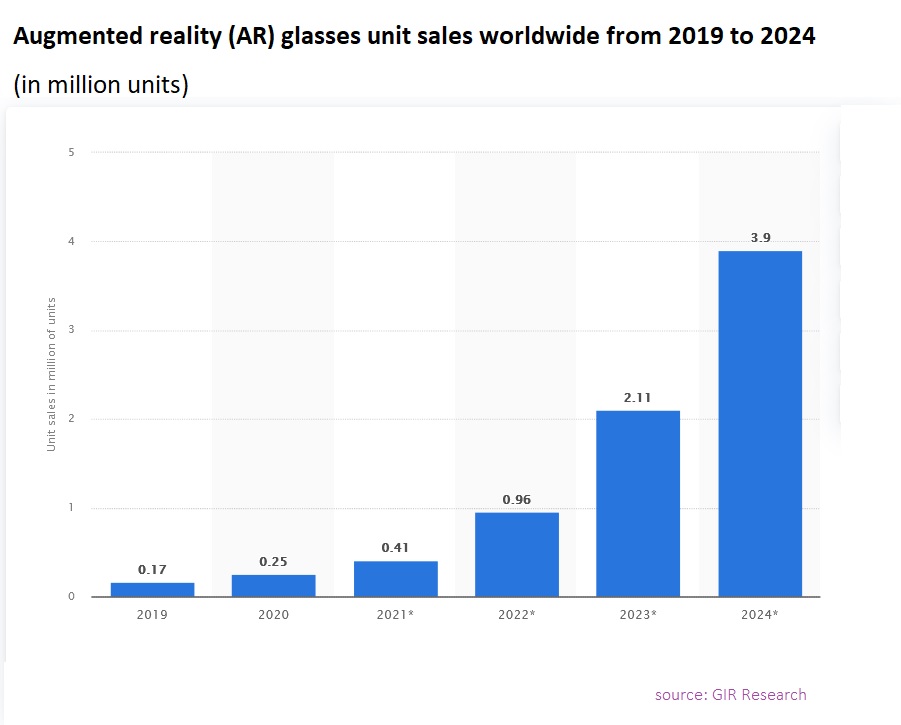
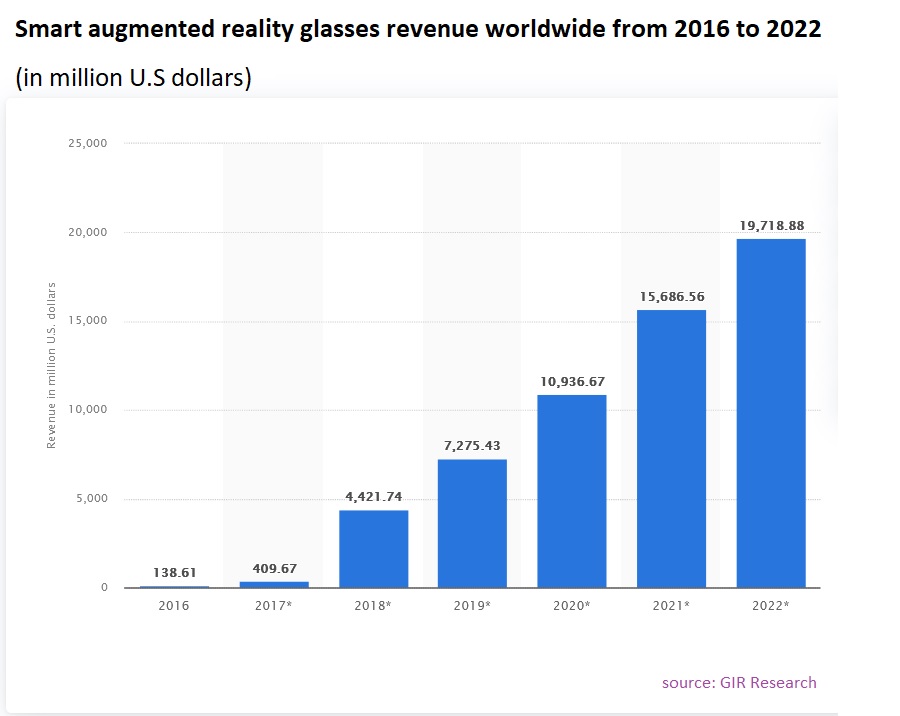
- Unit Sales, Average Selling Prices, Market Size & Growth Trends
- COVID-19 Impact and Global Recession Analysis
- Analysis of US inflation reduction act 2022
- Global competitiveness and key competitor percentage market shares
- Market presence across multiple geographies – Strong/Active/Niche/Trivial
- Online interactive peer-to-peer collaborative bespoke updates
- Market Drivers & Limiters
- Market Forecasts Until 2028, and Historical Data to 2015
- Recent Mergers & Acquisitions
- Company Profiles and Product Portfolios
- Leading Competitors
The Report Includes:
- The report provides a deep dive into details of the industry including definitions, classifications, and industry chain structure.
- Analysis of key supply-side and demand trends.
- Detailed segmentation of international and local products.
- Historic volume and value sizes, company, and brand market shares.
- Five-year forecasts of market trends and market growth.
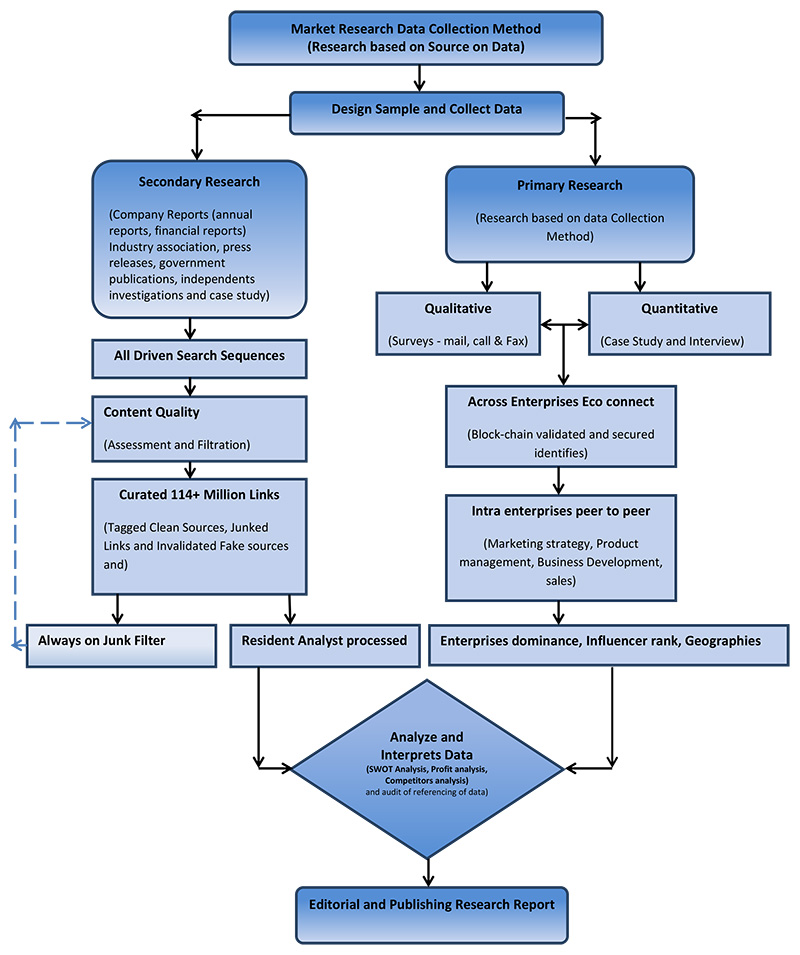
- Robust and transparent research methodology conducted in-country.
- Qualitative and quantitative analysis of the market based on segmentation involving both economic as well as non-economic factors.
- Provision of market value (USD Billion) data for each segment and sub-segment.
- Analysis by geography, region, Country, and its states.
- A brief overview of the commercial potential of products, technologies, and applications.
- Company profiles of leading market participants dealing in products category.
- Description of properties and manufacturing processes.
- marketed segments on the basis of type, application, end users, region, and others.
- Discussion of the current state, setbacks, innovations, and future needs of the market.
- Examination of the market by application and by product sizes; utility-scale, medium scale and small-scale.
- Country-specific data and analysis for the United States, Russia, China, Germany, United Kingdom, France, Japan, Israel, Saudi Arabia, South Korea, United Arab Emirates, Canada, Switzerland, Australia, India, Italy, Turkey, Qatar, Sweden, Spain, Belgium, Netherlands, Norway, Singapore, Egypt, Denmark, Austria, Vietnam, Brazil, Argentina, Mexico, South Africa, and others.
- Coverage of historical overview, key industrial development and regulatory framework.
- Analysis of competitive developments, such as contracts & agreements, expansions, new product developments, and mergers & acquisitions in the market.
- A look at the opportunities in the market for stakeholders and provide a competitive landscape of the market leaders.
Reports Scope and Segments:
| Report Attribute | Details |
| Market size in 2022 | US$15.2 Billion |
| Market size forecast in 2030 | US$33.8 Billion |
| Growth Rate | CAGR of 10.5% from 2022 to 2030 |
| Base year for estimation | 2022 |
| Historical data | 2015 – 2022 |
| Forecast period | 2023 – 2030 |
| Quantitative units | Revenue in USD million and CAGR from 2023 to 2030 |
| Report coverage | Revenue forecast, company ranking, competitive landscape, growth factors, trends, DROT Analysis, Market Dynamics and Challenges, and Strategic Growth Initiatives
COVID-19 Impact, Market Growth Trends, Market Limiters, Competitive Analysis & SWOT for Top Competitors, Mergers & Acquisitions, Company Profiles, Product Portfolios Market Size, Market Shares, Market Forecasts, Market Growth Rates, Units Sold, and Average Selling Prices. |
| Segments covered | Technology, Equipment Type, Product, Application and Region |
| Regional scope | North America; Europe; Asia Pacific; Latin America; Middle East and Africa and rest of the world |
| Country scope | United States, Russia, China, Germany, United Kingdom, France, Japan, Israel, Saudi Arabia, South Korea, United Arab Emirates, Canada, Switzerland, Australia, India, Italy, Turkey, Qatar, Sweden, Spain, Belgium, Netherlands, Norway, Singapore, Egypt, Denmark, Austria, Vietnam, Brazil, Argentina, Mexico, South Africa, and others. |
| Key companies profiled | Alphabet Inc. (Google Inc.); AltoTech; Amazon; Apple Inc.; Atheer Inc; Avegant Corp.; Baidu; Blippar Limited; Brother; C Wear Technologies AB; Campfire; Canon; Caputer; CastAR; Daqri LLC; Elbit Systems Ltd.; Epson; Everysight Ltd.; FlexEl, LLC.; Foxconn; Fujitsu; Fusar; Glassup Srl; HTC Corp.; Innovega; Intel; Iristick NV; Konica Minolta; Kopin Corp.; LAFORGE Optical Inc.; Laster; Lenovo Group; LG; Lumus Ltd.; MAD Gaze; Magic Leap, Inc.; Meta Platforms Inc.; MicroOLED; Microsoft Corp.; Mirama; Nokia; North Inc.; Nreal Corp.; NVIS, Inc.; Oakley; Oculus VR; Olympus; Optinvent S.A.; Osterhout Design Group; Penny AB; Pico Interactive; PTC Inc.; RealWear Inc.; Recon Instruments; Ricoh Co. Ltd.; RideOn; Rokid Corporation; Royole Corporation; Samsung Electronics; Seebright; Seiko Epson Corp.; Shadow Creator Information Technology Co., Ltd.; Six15 Technologies; Skully Helmets; Snap Inc.; Sony Corp.; TeamViewer AG; Theia; ThirdEye Gen, Inc.; Tobii AB; Toshiba Corp.; Upskill; Vuzix Corp.; Wikitude GmbH; Xiaomi Corporation; XOEye Technologies; Zappar Limited; Zebra Technologies and others |
| Customization scope | Free report customization (equivalent up to 20 analyst’s working days) with purchase. Addition or alteration to country, regional & segment scope. |
| Report Format | PDF, PPT, Excel & Online User Account |
Report Segmented by:
By Technology:
* AR technology:
o Marker-based AR technology:
+ Active marker
+ Passive marker
o Markerless AR technology
+ Model-base tracking
+ Image processing based tracking
+ Anchor-based AR
* VR Technology
o Non-immersive technology
o Semi-immersive and fully immersive technology
By Offering:
* Hardware
o Sensors
+ Accelerometers
+ Gyroscopes
+ Magnetometers
+ Proximity sensors
o Semiconductor components:
+ Controllers and processors
+ Integrated Circuits
o Display and projectors
o Position trackers
o Cameras
o Others
+ Computers
+ Video generators and combiners
* Software
o Software development kits
o Cloud-based services
By Device:
* AR devices
o Head-mounted displays
+ AR smart glasses
+ Smart helmets
o Heads-up display
* VR devices
o Head-mounted displays
o Gesture-tracking devices
o Displays and projectors
* Holographic Displays
* Smart Helmets
By Application:
* Consumer
o Gaming
o Sports
o Entertainment
+ Theme parks
+ Museums
+ Art exhibitions and gelleries
* Commercial
o Retail and e-commerce
+ Beauty and cosmetics
+ Apparel fitting
+ Jewelry
+ Grocery shopping
+ Footwear
+ Furniture
o Travel and tourism
o E-learning
* Enterprise
o Manufacturing
* Healthcare
o Surgery
o Fitness management
o Patient care management
o Pharmacy management
o Medical training and education
o Radiology
* Aerospace and Defense
* Automotive
* Energy
* Others
o Construction
o Agriculture
o Telecom/IT services
o Transportation and Logistics
o Public Safety
By Enterprise:
* Small enterprise
* Medium enterprise
* Large enterprise
By Region:
* North America
* Europe
* Asia Pacific
* Latin America
* Middle East & Africa
* Rest Of The World
Companies Covered in Report:
| Alphabet Inc. (Google Inc.) | Mirama |
| AltoTech | Nokia |
| Amazon | North Inc. |
| Apple Inc. | Nreal Corp. |
| Atheer Inc | NVIS, Inc. |
| Avegant Corp. | Oakley |
| Baidu | Oculus VR |
| Blippar Limited | Olympus |
| Brother | Optinvent S.A. |
| C Wear Technologies AB | Osterhout Design Group |
| Campfire | Penny AB |
| Canon | Pico Interactive |
| Caputer | PTC Inc. |
| CastAR | RealWear Inc. |
| Daqri LLC | Recon Instruments |
| Elbit Systems Ltd. | Ricoh Co. Ltd. |
| Epson | RideOn |
| Everysight Ltd. | Rokid Corporation |
| FlexEl, LLC. | Royole Corporation |
| Foxconn | Samsung Electronics |
| Fujitsu | Seebright |
| Fusar | Seiko Epson Corp. |
| Glassup Srl | Shadow Creator Information Technology Co., Ltd. |
| HTC Corp. | Six15 Technologies |
| Innovega | Skully Helmets |
| Intel | Snap Inc. |
| Iristick NV | Sony Corp. |
| Konica Minolta | TeamViewer AG |
| Kopin Corp. | Theia |
| LAFORGE Optical Inc. | ThirdEye Gen, Inc. |
| Laster | Tobii AB |
| Lenovo Group | Toshiba Corp. |
| LG | Upskill |
| Lumus Ltd. | Vuzix Corp. |
| MAD Gaze | Wikitude GmbH |
| Magic Leap, Inc. | Xiaomi Corporation |
| Meta Platforms Inc. | XOEye Technologies |
| MicroOLED | Zappar Limited |
| Microsoft Corp. | Zebra Technologies |
After Sales Support
- Every updated edition of the report and full data stack will be provided at no extra cost for 24 months.
- Latest 2022 base year report.
- Free Updated edition of 2023 every quarter without any hidden cost.
- No user limitation for the report. Unlimited access within the organization.
- Unrestricted post-sales support at no additional cost
- Free report customization (equivalent up to 10 analyst’s working days) with purchase. Addition or alteration to country, regional & segment scope
- Global Industry Reports will support your post-purchase for a period of 24 months to answer any of your queries related to the following market and to provide you any more data needed, for your analysis.
- Option to purchase regional or selected Chapters from the report.
Key Questions Answered in this Report
- How will the smart augmented reality market evolve?
- Who are the key players in smart augmented reality market? What are their strategies?
- What is the competitive landscape?
- What are the needs, challenges, and solutions in smart augmented reality market?
- What’s the value chain for AR Glasses?
- What’s the forecast for smart augmented reality market adoption in the next decade?
- What are the drivers for adoption of smart augmented reality?
- What’s the right price? The right timing?
- Will this market happen at all? How big can it get?