

Report Overview
- Understand the latest market trends and future growth opportunities for the Automotive Transmission Systems industry globally with research from the Global Industry Reports team of in-country analysts – experts by industry and geographic specialization.
- Key trends are clearly and succinctly summarized alongside the most current research data available. Understand and assess competitive threats and plan corporate strategy with our qualitative analysis, insight, and confident growth projections.
- The report will cover the overall analysis and insights in relation to the size and growth rate of the “Automotive Transmission Systems Market” by various segments at a global and regional level for the 2010-2030 period, with 2010-2021 as historical data, 2022 as a base year, 2023 as an estimated year and 2023-2030 as forecast period.
Description:
- In the changed post COVID-19 business landscape, the global market for Automotive Transmission Systems estimated at US$155.5 Billion in the year 2022, is projected to reach a revised size of US$223.8 Billion by 2030, growing at a CAGR of 4.7% over the analysis period 2022-2030.
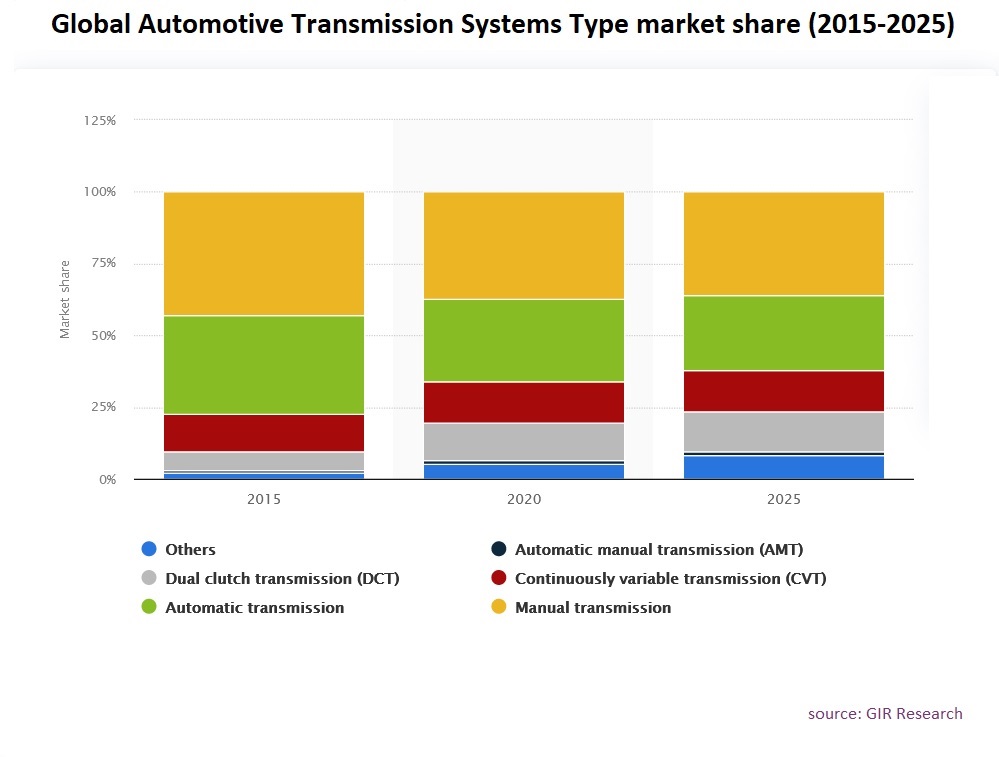
- Manual Transmission, one of the segments analyzed in the report, is projected to record a 5.1% CAGR and reach US$125.6 Billion by the end of the analysis period. Taking into account the ongoing post pandemic recovery, growth in the Automatic Transmission segment is readjusted to a revised 5.3% CAGR for the next 8-year period.
- The Automotive Transmission Systems market in the U.S. is estimated at US$42.4 Billion in the year 2022. China, the world`s second largest economy, is forecast to reach a projected market size of US$48 Billion by the year 2030 trailing a CAGR of 7.9% over the analysis period 2022 to 2030. Among the other noteworthy geographic markets are Japan and Canada, each forecast to grow at 2.4% and 3.8% respectively over the 2022-2030 period. Within Europe, Germany is forecast to grow at approximately 3.1% CAGR. Led by countries such as Australia, India, and South Korea, the market in Asia-Pacific is forecast to reach US$30.2 Billion by the year 2030.

MARKET DATA INCLUDED
- Unit Sales, Average Selling Prices, Market Size & Growth Trends
- COVID-19 Impact and Global Recession Analysis
- Analysis of US inflation reduction act 2022
- Global competitiveness and key competitor percentage market shares
- Market presence across multiple geographies – Strong/Active/Niche/Trivial
- Online interactive peer-to-peer collaborative bespoke updates
- Market Drivers & Limiters
- Market Forecasts Until 2030, and Historical Data up to 2015
- Recent Mergers & Acquisitions
- Company Profiles and Product Portfolios
- Leading Competitors
The Report Includes:
- The report provides a deep dive into details of the industry including definitions, classifications, and industry chain structure.
- Analysis of key supply-side and demand trends.
- Detailed segmentation of international and local products.
- Historic volume and value sizes, company, and brand market shares.
- Five-year forecasts of market trends and market growth.
- Robust and transparent research methodology conducted in-country.
- Qualitative and quantitative analysis of the market based on segmentation involving both economic as well as non-economic factors.
- Provision of market value (USD Billion) data for each segment and sub-segment.
- Analysis by geography, region, Country, and its states.
- A brief overview of the commercial potential of products, technologies, and applications.
- Company profiles of leading market participants dealing in products category.
- Description of properties and manufacturing processes.
- marketed segments on the basis of type, application, end users, region, and others.
- Discussion of the current state, setbacks, innovations, and future needs of the market.
- Examination of the market by application and by product sizes; utility-scale, medium scale and small-scale.
- Country-specific data and analysis for the United States, Russia, China, Germany, United Kingdom, France, Japan, Israel, Saudi Arabia, South Korea, United Arab Emirates, Canada, Switzerland, Australia, India, Italy, Turkey, Qatar, Sweden, Spain, Belgium, Netherlands, Norway, Singapore, Egypt, Denmark, Austria, Vietnam, Brazil, Argentina, Mexico, South Africa, and others.
- Coverage of historical overview, key industrial development and regulatory framework.
- Analysis of competitive developments, such as contracts & agreements, expansions, new product developments, and mergers & acquisitions in the market.
- A look at the opportunities in the market for stakeholders and provide a competitive landscape of the market leaders.
Reports Scope and Segments:
| Report Attribute | Details |
| Market size in 2022 | USD 155.5 Billion USD |
| Market forecast in 2030 | USD 223.8 Billion USD |
| Growth Rate | CAGR of 4.7% from 2023 to 2030 |
| Base year for estimation | 2022 |
| Historical data | 2015 – 2022 |
| Forecast period | 2023 – 2030 |
| Quantitative units | Revenue in USD million and CAGR from 2023 to 2030 |
| Report coverage | Revenue forecast, company ranking, competitive landscape, growth factors, trends, DROT Analysis, Market Dynamics and Challenges, and Strategic Growth Initiatives
COVID-19 Impact, Market Growth Trends, Market Limiters, Competitive Analysis & SWOT for Top Competitors, Mergers & Acquisitions, Company Profiles, Product Portfolios, Disease Overviews. Market Size, Market Shares, Market Forecasts, Market Growth Rates, Units Sold, and Average Selling Prices. |
| Segments covered | Type, Technology, Material, Application, End Use & Region |
| Regional scope | North America; Europe; Asia Pacific; Latin America; Middle East and Africa and rest of the world |
| Country scope | United States, Russia, China, Germany, United Kingdom, France, Japan, Israel, Saudi Arabia, South Korea, United Arab Emirates, Canada, Switzerland, Australia, India, Italy, Turkey, Qatar, Sweden, Spain, Belgium, Netherlands, Norway, Singapore, Egypt, Denmark, Austria, Vietnam, Brazil, Argentina, Mexico, South Africa, and others. |
| Key companies profiled | African Transmission Industries; Aichi Machine Industry Co. Ltd; Aisin Seiki Co. Ltd.; Allison Transmission Inc.; ALMCO Group; Amara Raja Group; American Axle & Manufacturing (AAM); Arabian Axles; AVL List GmbH; Behbehani Brothers W.L.L.; Bharat Gears Ltd.; Bonfiglioli RIDUTTORI S.P.A.; BorgWarner Inc.; Chery Automobile Co., Ltd.; Chongqing Tsingshan Industrial Co., Ltd.; Continental AG; Dana Incorporated; Eaton Corporation PLC; Egypt Automotive Trading Co. (EATC); Ethiopian Auto Industry PLC; Exedy India Ltd.; FPT Industrial S.p.A.; Geely Automobile Holdings Ltd.; General Motors Company; Getrag B.V; Ghandhara Nissan Limited; GKN Automotive Limited; Great Wall Motor Co., Ltd.; Groupe Renault; Hella GmbH & Co. KGaA; Hero MotoCorp Ltd.; Honda Transmission Manufacturing of America, Inc.; Hyundai Dymos Inc.; Hyundai Transys Inc.; JATCO Ltd; LuK GmbH & Co. KG; Magana International Inc.; Magneti Marelli S.P.A.; Mahindra CIE Automotive Ltd.; Meritor, Inc.; Metalac Group; Nigeria Machine Tools Limited; Oerlikon Graziano; Punch Powertrain NV; Ricardo Plc; Robert Bosch GmbH; SAIC Motor Corporation Limited; Schaeffler AG; Shaanxi Fast Auto Drive Group Company; Sona Group; Subaru Corporation; Sudanese Japanese Company; Sundaram-Clayton Ltd.; Tata AutoComp Systems Ltd.; Tremec Corporation; Valeo SA; Vitesco Technologies; Voith Group; Volkswagen Aktiengesellschaft; Xtrac Limited; ZF Friedrichshafen AG; Zhejiang Wanliyang Transmission Co., Ltd. and others. |
| Customization scope | Free report customization (equivalent up to 20 analyst’s working days) with purchase. Addition or alteration to country, regional & segment scope. |
| Report Format | PDF, PPT, Excel & Online User Account |
Report Segmented by:
By Transmission Type:
- Manual
- Automatic
- Automatic Manual Transmission (AMT)
- Continuously Variable Transmission (CVT)
- Dual-Clutch Transmission (DCT)
- Hybrid transmission
- Others
By Fuel Type:
- Gasoline
- Diesel
- Others
By Vehicle Type:
- Passenger Cars
- LCVs
- HCVs
- Others
By Region:
- North America
- Europe
- Asia Pacific
- Latin America
- Middle East & Africa
- Rest of The World
Companies Covered in Report:
| African Transmission Industries | Honda Transmission Manufacturing of America, Inc. |
| Aichi Machine Industry Co. Ltd | Hyundai Dymos Inc. |
| Aisin Seiki Co. Ltd. | Hyundai Transys Inc. |
| Allison Transmission Inc. | JATCO Ltd |
| ALMCO Group | LuK GmbH & Co. KG |
| Amara Raja Group | Magana International Inc. |
| American Axle & Manufacturing (AAM) | Magneti Marelli S.P.A. |
| Arabian Axles | Mahindra CIE Automotive Ltd. |
| AVL List GmbH | Meritor, Inc. |
| Behbehani Brothers W.L.L. | Metalac Group |
| Bharat Gears Ltd. | Nigeria Machine Tools Limited |
| Bonfiglioli RIDUTTORI S.P.A. | Oerlikon Graziano |
| BorgWarner Inc. | Punch Powertrain NV |
| Chery Automobile Co., Ltd. | Ricardo Plc |
| Chongqing Tsingshan Industrial Co., Ltd. | Robert Bosch GmbH |
| Continental AG | SAIC Motor Corporation Limited |
| Dana Incorporated | Schaeffler AG |
| Eaton Corporation PLC | Shaanxi Fast Auto Drive Group Company |
| Egypt Automotive Trading Co. (EATC) | Sona Group |
| Ethiopian Auto Industry PLC | Subaru Corporation |
| Exedy India Ltd. | Sudanese Japanese Company |
| FPT Industrial S.p.A. | Sundaram-Clayton Ltd. |
| Geely Automobile Holdings Ltd. | Tata AutoComp Systems Ltd. |
| General Motors Company | Tremec Corporation |
| Getrag B.V | Valeo SA |
| Ghandhara Nissan Limited | Vitesco Technologies |
| GKN Automotive Limited | Voith Group |
| Great Wall Motor Co., Ltd. | Volkswagen Aktiengesellschaft |
| Groupe Renault | Xtrac Limited |
| Hella GmbH & Co. KGaA | ZF Friedrichshafen AG |
| Hero MotoCorp Ltd. | Zhejiang Wanliyang Transmission Co., Ltd. |
After Sales Support
- Every updated edition of the report and full data stack will be provided at no extra cost for 24 months.
- Latest 2022 base year report.
- Free Updated edition of 2023 every quarter without any hidden cost.
- No user limitation for the report. Unlimited access within the organization.
- Unrestricted post-sales support at no additional cost
- Free report customization (equivalent up to 10 analyst’s working days) with purchase. Addition or alteration to country, regional & segment scope
- Global Industry Reports will support your post-purchase for a period of 24 months to answer any of your queries related to the following market and to provide you any more data needed, for your analysis.
- Option to purchase regional or some selected Chapters from the report.
Key questions that are answered in this report
- What is the total market of Automotive Transmission Systems in 2023?
- What is the total CAGR expected to be recorded for the Automotive Transmission Systems market during 2022-2030?
- What are the driving factors for the Automotive Transmission Systems market?
- Which are the significant players operating in the Automotive Transmission Systems market?
- Which region will grow at a fast rate in the future?
- How big is the Automotive Transmission Systems market?
- What are the Challenges in Automotive Transmission Systems market?
- What is the Restraint in Automotive Transmission Systems market?
- What Company Leading the North America Automotive Transmission Systems market?
- What are Opportunities in Automotive Transmission Systems market?
- Which Region is largest share of Market in Asia pacific?