
Report Overview
- Understand the latest market trends and future growth opportunities for the Building Integrated Photovoltaics (BiPV) industry globally with research from the Global Industry Reports team of in-country analysts – experts by industry and geographic specialization.
- Key trends are clearly and succinctly summarized alongside the most current research data available. Understand and assess competitive threats and plan corporate strategy with our qualitative analysis, insight, and confident growth projections.
- The report will cover the overall analysis and insights in relation to the size and growth rate of the “Building Integrated Photovoltaics (BiPV) Market” by various segments at a global and regional level for the 2010-2030 period, with 2010-2021 as historical data, 2022 as a base year, 2023 as an estimated year and 2023-2030 as forecast period.
Description:
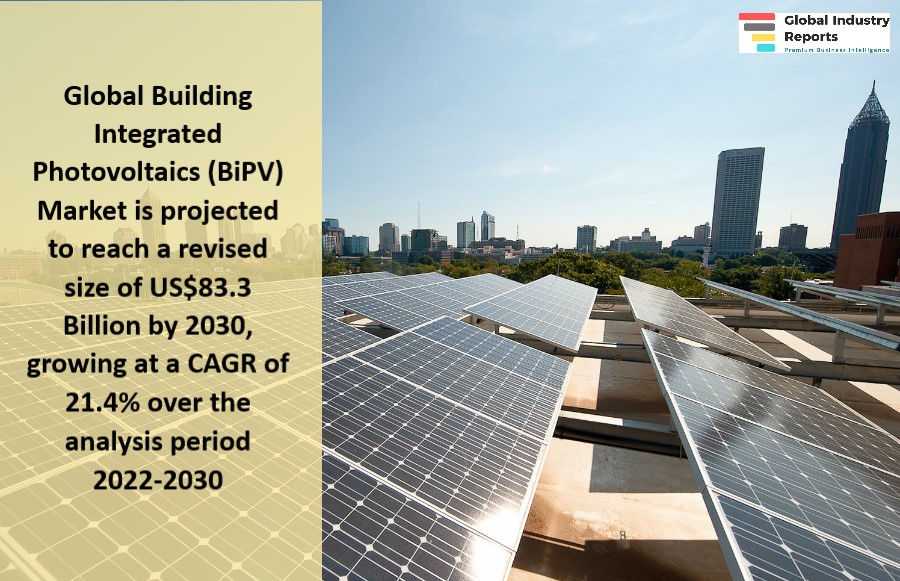
- In the changed post COVID-19 business landscape, the global market for Building Integrated Photovoltaics (BiPV) estimated at US$17.7 Billion in the year 2022, is projected to reach a revised size of US$83.3 Billion by 2030, growing at a CAGR of 21.4% over the analysis period 2022-2030.
- C-Si, one of the segments analyzed in the report, is projected to record a 21% CAGR and reach US$58.4 Billion by the end of the analysis period. Taking into account the ongoing post pandemic recovery, growth in the Thin Film segment is readjusted to a revised 23.7% CAGR for the next 8-year period.
- The Building Integrated Photovoltaics (BiPV) market in the U.S. is estimated at US$2.9 Billion in the year 2022. China, the world`s second largest economy, is forecast to reach a projected market size of US$17.9 Billion by the year 2030 trailing a CAGR of 25.4% over the analysis period 2022 to 2030. Among the other noteworthy geographic markets are Japan and Canada, each forecast to grow at 16.8% and 20.4% respectively over the 2022-2030 period. Within Europe, Germany is forecast to grow at approximately 21.5% CAGR. Led by countries such as Australia, India, and South Korea, the market in Asia-Pacific is forecast to reach US$10.8 Billion by the year 2030.
MARKET DATA INCLUDED
- Unit Sales, Average Selling Prices, Market Size & Growth Trends
- COVID-19 Impact and Global Recession Analysis
- Analysis of US inflation reduction act 2022
- Global competitiveness and key competitor percentage market shares
- Market presence across multiple geographies – Strong/Active/Niche/Trivial
- Online interactive peer-to-peer collaborative bespoke updates
- Market Drivers & Limiters
- Market Forecasts Until 2030, and Historical Data up to 2015
- Recent Mergers & Acquisitions
- Company Profiles and Product Portfolios
- Leading Competitors
The Report Includes:
- The report provides a deep dive into details of the industry including definitions, classifications, and industry chain structure.
- Analysis of key supply-side and demand trends.
- Detailed segmentation of international and local products.
- Historic volume and value sizes, company, and brand market shares.
- Five-year forecasts of market trends and market growth.
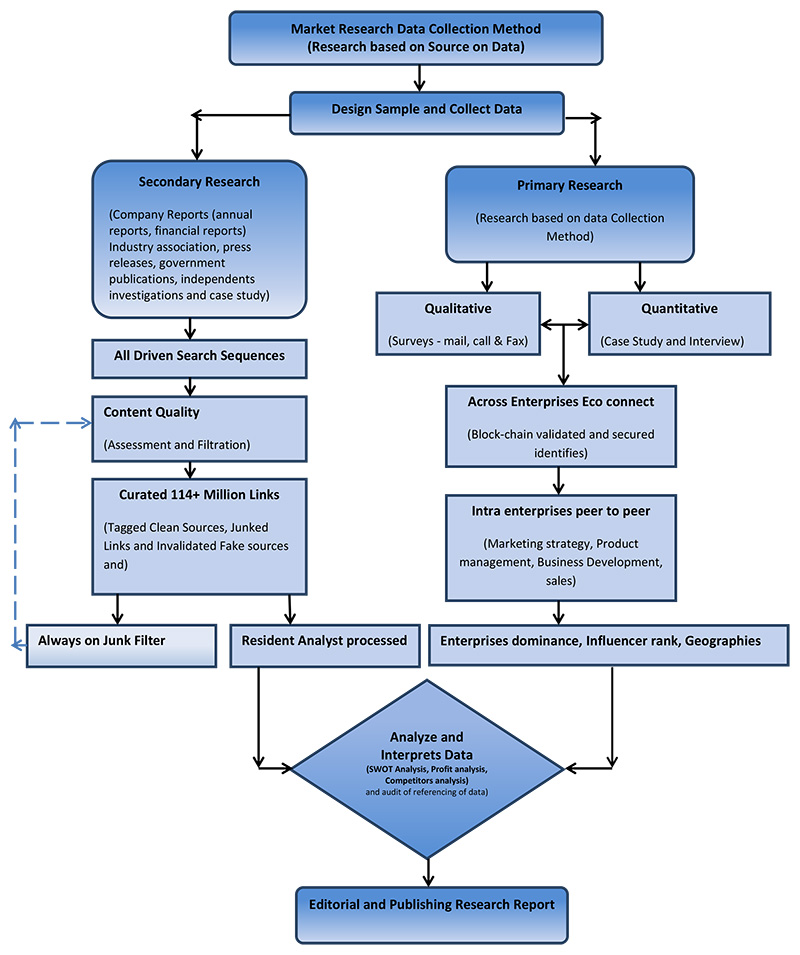
- Robust and transparent research methodology conducted in-country.
- Qualitative and quantitative analysis of the market based on segmentation involving both economic as well as non-economic factors.
- Provision of market value (USD Billion) data for each segment and sub-segment.
- Analysis by geography, region, Country, and its states.
- A brief overview of the commercial potential of products, technologies, and applications.
- Company profiles of leading market participants dealing in products category.
- Description of properties and manufacturing processes.
- marketed segments on the basis of type, application, end users, region, and others.
- Discussion of the current state, setbacks, innovations, and future needs of the market.
- Examination of the market by application and by product sizes; utility-scale, medium scale and small-scale.
- Country-specific data and analysis for the United States, Russia, China, Germany, United Kingdom, France, Japan, Israel, Saudi Arabia, South Korea, United Arab Emirates, Canada, Switzerland, Australia, India, Italy, Turkey, Qatar, Sweden, Spain, Belgium, Netherlands, Norway, Singapore, Egypt, Denmark, Austria, Vietnam, Brazil, Argentina, Mexico, South Africa, and others.
- Coverage of historical overview, key industrial development and regulatory framework.
- Analysis of competitive developments, such as contracts & agreements, expansions, new product developments, and mergers & acquisitions in the market.
- A look at the opportunities in the market for stakeholders and provide a competitive landscape of the market leaders.
Reports Scope and Segments:
| Report Attribute | Details |
| Market size value in 2022 | USD 17.7 Billion |
| Revenue forecast in 2030 | USD 83.3 Billion |
| Growth Rate | CAGR of 21.4% from 2022 to 2030 |
| Base year for estimation | 2022 |
| Historical data | 2015 – 2021 |
| Forecast period | 2023 – 2030 |
| Quantitative units | Revenue in USD million and CAGR from 2023 to 2030 |
| Report coverage | Revenue forecast, company ranking, competitive landscape, growth factors, trends, DROT Analysis, Market Dynamics and Challenges, and Strategic Growth Initiatives
COVID-19 Impact, Market Growth Trends, Market Limiters, Competitive Analysis & SWOT for Top Competitors, Mergers & Acquisitions, Company Profiles, Product Portfolios, Disease Overviews. Market Size, Market Shares, Market Forecasts, Market Growth Rates, Units Sold, and Average Selling Prices. |
| Segments covered | Material, Type, Technology, Platform,Capacity, Voltage, Application & Region |
| Regional scope | North America; Europe; Asia Pacific; Latin America; Middle East and Africa and rest of the world |
| Country scope | United States, Russia, China, Germany, United Kingdom, France, Japan, Israel, Saudi Arabia, South Korea, United Arab Emirates, Canada, Switzerland, Australia, India, Italy, Turkey, Qatar, Sweden, Spain, Belgium, Netherlands, Norway, Singapore, Egypt, Denmark, Austria, Vietnam, Brazil, Argentina, Mexico, South Africa, and others. |
| Key companies profiled | AEET Energy Group; AGC Inc.; Ankara Solar AS; Ascent Solar Technologies, Inc.; AVANCIS GMBH; BELECTRIC GmbH; BIPVco; BISOL; Canadian Solar, Inc.; Carmanah Technologies Corp.; CertainTeed Corporation; Changzhou Almaden Co. Ltd; Dow; Dyesol Ltd.; Ertex Solar Technik GmbH; First Solar, Inc.; Global Solar Energy, Inc.; Greatcell Energy Limited; Hanergy Holding Group; Hanwha Solar; Heliatek GmbH; Hermans Techniglaz; ISSOL SA; Jinko Solar; KANEKA CORP.; KYOCERA Corporation; Merck KGaA; METSOLAR; NANOFLEX POWER CORP.; NanoPV Solar Inc.; Nippon Sheet Glass; NOVERGY ENERGY SOLUTIONS PVT. LTD.; Onyx Solar Group; Panasonic; Polysolar; REC Solar Holdings AS; Romag; Scheuten Glas Nederland B.V.; Sharp Corporation; Solar day; Solar Frontier K.K; Solarcentury; Solarwatt; SolarWindow Technologies, Inc.; SPHELAR POWER CORP.; SUNPOWER CORP.; Taiyo Kogyo Corporation; Tesla; The Solaria Corporation; Topsun Energy; Tractile; Trina Solar; ViaSolis; Visaka Industries; Wuxi Suntech Power Co.; Yingli Green Energy Holding and others |
| Customization scope | Free report customization (equivalent up to 20 analyst’s working days) with purchase. Addition or alteration to country, regional & segment scope. |
| Report Format | PDF, PPT, Excel & Online User Account |
Report Segmented by:
Technology
- Thin-Films
- Crystalline Silicon (C-Si)
- Mounting Systems
- Others
Raw Material
- Crystalline Silicon
- Amorphous Silicon
- Organic photo Voltaic Cell
- Dye Sensitized Solar Cells
- Cadmium Telluride
- Copper Indium Gallium Selenide
- Others
Application
- Roof
- Facades and Windows
- Walls
- Glass
- Atrium’s
- Canopies
- Skylight or Solar Glazing
- Other
End-user
- Commercial
- Industrial
- Residential
- Others
By Geography:
- North America
- Europe
- Asia Pacific
- Latin America
- Middle East & Africa
- Rest of the World
Companies Covered in Report:
| AEET Energy Group | NANOFLEX POWER CORP. |
| AGC Inc. | NanoPV Solar Inc. |
| Ankara Solar AS | Nippon Sheet Glass |
| Ascent Solar Technologies, Inc. | NOVERGY ENERGY SOLUTIONS PVT. LTD. |
| AVANCIS GMBH | Onyx Solar Group |
| BELECTRIC GmbH | Panasonic |
| BIPVco | Polysolar |
| BISOL | REC Solar Holdings AS |
| Canadian Solar, Inc. | Romag |
| Carmanah Technologies Corp. | Scheuten Glas Nederland B.V. |
| CertainTeed Corporation | Sharp Corporation |
| Changzhou Almaden Co. Ltd | Solar day |
| Dow | Solar Frontier K.K |
| Dyesol Ltd. | Solarcentury |
| Ertex Solar Technik GmbH | Solarwatt |
| First Solar, Inc. | SolarWindow Technologies, Inc. |
| Global Solar Energy, Inc. | SPHELAR POWER CORP. |
| Greatcell Energy Limited | SUNPOWER CORP. |
| Hanergy Holding Group | Taiyo Kogyo Corporation |
| Hanwha Solar | Tesla |
| Heliatek GmbH | The Solaria Corporation |
| Hermans Techniglaz | Topsun Energy |
| ISSOL SA | Tractile |
| Jinko Solar | Trina Solar |
| KANEKA CORP. | ViaSolis |
| KYOCERA Corporation | Visaka Industries |
| Merck KGaA | Wuxi Suntech Power Co. |
| METSOLAR | Yingli Green Energy Holding |
After Sales Support
- Every updated edition of the report and full data stack will be provided at no extra cost for 24 months.
- Latest 2022 base year report.
- Free Updated edition of 2023 every quarter without any hidden cost.
- No user limitation for the report. Unlimited access within the organization.
- Unrestricted post-sales support at no additional cost
- Free report customization (equivalent up to 10 analyst’s working days) with purchase. Addition or alteration to country, regional & segment scope
- Global Industry Reports will support your post-purchase for a period of 24 months to answer any of your queries related to the following market and to provide you any more data needed, for your analysis.
- Option to purchase regional or some selected Chapters from the report.
Key questions that are answered in this report
- What are the restraints in the building integrated photovoltaics (BiPV) market?
- What are the technological trends going in the building integrated photovoltaics (BiPV) market?
- Which are the major companies in the building integrated photovoltaics (BiPV) market?
- What elements are fueling the building integrated photovoltaics (BiPV) market’s expansion?
- What sectors make up the building integrated photovoltaics (BiPV) market?
- What market opportunities exist for growth in the building integrated photovoltaics (BiPV) market sector?
- What are the various building integrated photovoltaics (BiPV) technologies that are offered on the market?
- What is the total CAGR expected to be recorded for the building integrated photovoltaics (BiPV) market during 2022-2030?
- What are the driving factors for the building integrated photovoltaics (BiPV) market?
- Which are the significant players operating in the building integrated photovoltaics (BiPV) market?
- Which region will lead the building integrated photovoltaics (BiPV) market in the future?