Global Advanced Driver Assistance Systems (ADAS) Market –Trends, Insights And Forecast 2023

  • Publish Date
    February 23, 2023
  • No of Pages
    410
  • SKU Code
    GIR 5804
  • Format

Report Overview

  • Understand the latest market trends and future growth opportunities for the Advanced Driver Assistance System (ADAS) industry globally with research from the Global Industry Reports team of in-country analysts – experts by industry and geographic specialization.
  • Key trends are clearly and succinctly summarized alongside the most current research data available. Understand and assess competitive threats and plan corporate strategy with our qualitative analysis, insight, and confident growth projections.
  • The report will cover the overall analysis and insights in relation to the size and growth rate of the “Advanced Driver Assistance System (ADAS) Market” by various segments at a global and regional level for the 2010-2028 period, with 2010-2021 as historical data, 2022 as a base year, 2023 as an estimated year and 2023-2028 as forecast period.

Description:

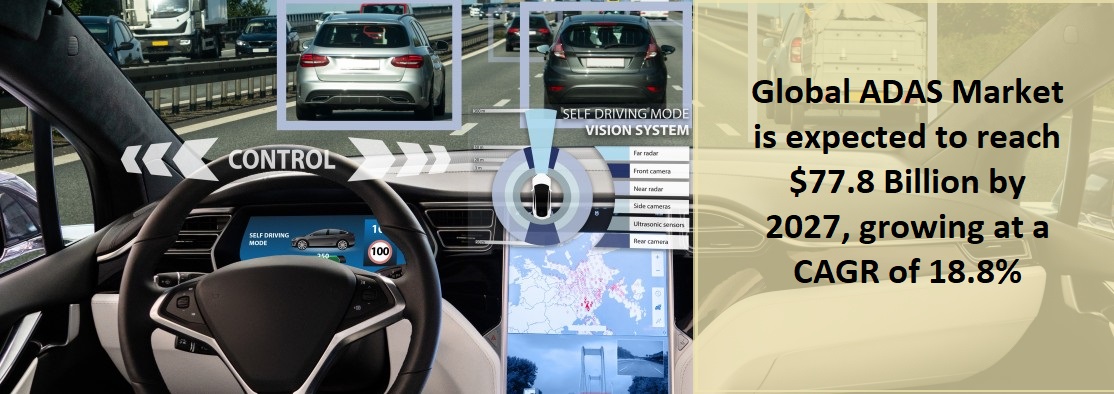
  • Amid the COVID-19 crisis, the global market for Advanced Driver Assistance System (ADAS) estimated at US$23.3 Billion in the year 2020, is projected to reach a revised size of US$77.8 Billion by 2027, growing at a CAGR of 18.8% over the analysis period 2021-2027.
  • Processor, one of the segments analyzed in the report, is projected to record a 20.6% CAGR and reach US$26.2 Billion by the end of the analysis period. Growth in the Sensors segment is readjusted to a revised 18% CAGR for the next 7-year period.
  • The U.S. Market is Estimated at $6.9 Billion, While China is Forecast to Grow at 18% CAGR. China, the world`s second largest economy, is forecast to reach a projected market size of US$13.3 Billion by the year 2027 trailing a CAGR of 18% over the analysis period 2021 to 2027. Among the other noteworthy geographic markets are Japan and Canada, each forecast to grow at 16.9% and 16.1% respectively over the 2021-2027 period. Within Europe, Germany is forecast to grow at approximately 13.7% CAGR.
  • In the global Software segment, USA, Canada, Japan, China and Europe will drive the 19.2% CAGR estimated for this segment. These regional markets accounting for a combined market size of US$2.7 Billion in the year 2020 will reach a projected size of US$9.2 Billion by the close of the analysis period. China will remain among the fastest growing in this cluster of regional markets. Led by countries such as Australia, India, and South Korea, the market in Asia-Pacific is forecast to reach US$9.3 Billion by the year 2027.

Advanced Driver Assistance System (ADAS) Market

MARKET DATA INCLUDED

  • Unit SalesAverage Selling PricesMarket Size & Growth Trends
  • COVID-19 Impact and Global Recession Analysis
  • Analysis of US inflation reduction act 2022
  • Global competitiveness and key competitor percentage market shares
  • Market presence across multiple geographies – Strong/Active/Niche/Trivial
  • Online interactive peer-to-peer collaborative bespoke updates
  • Market Drivers & Limiters
  • Market Forecasts Until 2028, and Historical Data to 2015
  • Recent Mergers & Acquisitions
  • Company Profiles and Product Portfolios
  • Leading Competitors

Advanced Driver Assistance System (ADAS) Market

The Report Includes:

  • The report provides a deep dive into details of the industry including definitions, classifications, and industry chain structure.
  • Analysis of key supply-side and demand trends.
  • Detailed segmentation of international and local products.
  • Historic volume and value sizes, company, and brand market shares.
  • Five-year forecasts of market trends and market growth.
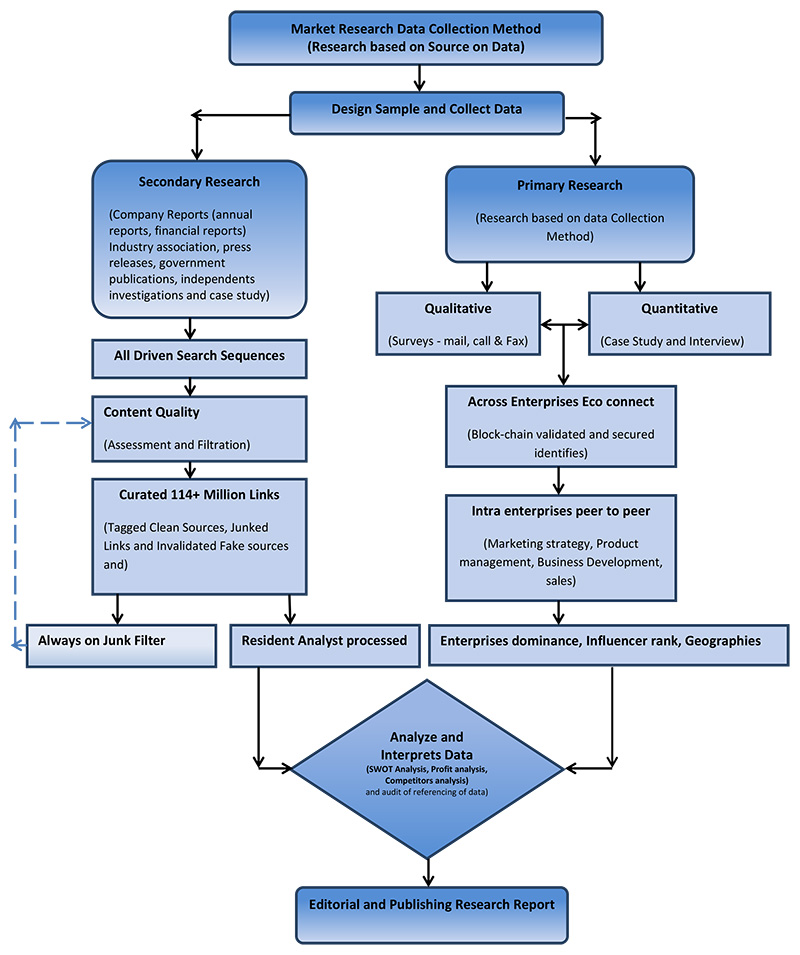
  • Robust and transparent research methodology conducted in-country.
  • Qualitative and quantitative analysis of the market based on segmentation involving both economic as well as non-economic factors.
  • Provision of market value (USD Billion) data for each segment and sub-segment.
  • Analysis by geography, region, Country, and its states.
  • A brief overview of the commercial potential of products, technologies, and applications.
  • Company profiles of leading market participants dealing in products category.
  • Description of properties and manufacturing processes.
  • marketed segments on the basis of type, application, end users, region, and others.
  • Discussion of the current state, setbacks, innovations, and future needs of the market.
  • Examination of the market by application and by product sizes; utility-scale, medium scale and small-scale.
  • Country-specific data and analysis for the United States, Russia, China, Germany, United Kingdom, France, Japan, Israel, Saudi Arabia, South Korea, United Arab Emirates, Canada, Switzerland, Australia, India, Italy, Turkey, Qatar, Sweden, Spain, Belgium, Netherlands, Norway, Singapore, Egypt, Denmark, Austria, Vietnam, Brazil, Argentina, Mexico, South Africa, and others.
  • Coverage of historical overview, key industrial development and regulatory framework.
  • Analysis of competitive developments, such as contracts & agreements, expansions, new product developments, and mergers & acquisitions in the market.
  • A look at the opportunities in the market for stakeholders and provide a competitive landscape of the market leaders.

Reports Scope and Segments:

Report Attribute Details
Market size value in 2022 USD 46.7 Billion
Revenue forecast in 2027 USD 77.8 Billion
Growth Rate CAGR of 18.8% from 2022 to 2028
Base year for estimation 2022
Historical data 2015 – 2021
Forecast period 2022 – 2028
Quantitative units Revenue in USD million and CAGR from 2022 to 2028
Report coverage Revenue forecast, company ranking, competitive landscape, growth factors, trends, DROT Analysis, Market Dynamics and Challenges, and Strategic Growth Initiatives

COVID-19 Impact, Market Growth Trends, Market Limiters, Competitive Analysis & SWOT for Top Competitors, Mergers & Acquisitions, Company Profiles, Product Portfolios, Disease Overviews.

Market Size, Market Shares, Market Forecasts, Market Growth Rates, Units Sold, and Average Selling Prices.

Segments covered Product, Type, Operation, Technology, Application, Region
Regional scope North America; Europe; Asia Pacific; Latin America; Middle East and Africa and rest of the world
Country scope United States, Russia, China, Germany, United Kingdom, France, Japan, Israel, Saudi Arabia, South Korea, United Arab Emirates, Canada, Switzerland, Australia, India, Italy, Turkey, Qatar, Sweden, Spain, Belgium, Netherlands, Norway, Singapore, Egypt, Denmark, Austria, Vietnam, Brazil, Argentina, Mexico, South Africa, and others.
Key companies profiled Aisin Seiki Co. Ltd.; Aptiv PLC; Autoliv Inc.; AVL GmbH; Continental AG; Delphi Automotive LLP; DENSO Corporation; Gentex Corporation; Harman International; Hella GmbH & Co. KGaA; Hitachi Ltd.; Hyundai Mobis Co. Ltd.; Infineon Technologies AG; Jayson Electronics; Lear Corporation; Magna International Inc.; Mobileye N.V. (Intel Corporation); NVIDIA Corporation; NXP Semiconductors N.V.; Osram Licht AG; Panasonic Corporation; Renesas Electronics Corporation; Robert Bosch; Siemens AG; STMicroelectronics N.V.; Tesla Inc.; Texas Instruments Inc.; TRW Automotive (ZF Group); Valeo SA; Veoneer Inc.; Volkswagen Group; ZF Friedrichshafen AG and others
Customization scope Free report customization (equivalent up to 20 analyst’s working days) with purchase. Addition or alteration to country, regional & segment scope.
Report Format PDF, PPT, Excel & Online User Account

ADAS Market

ADAS Report Segmented by:
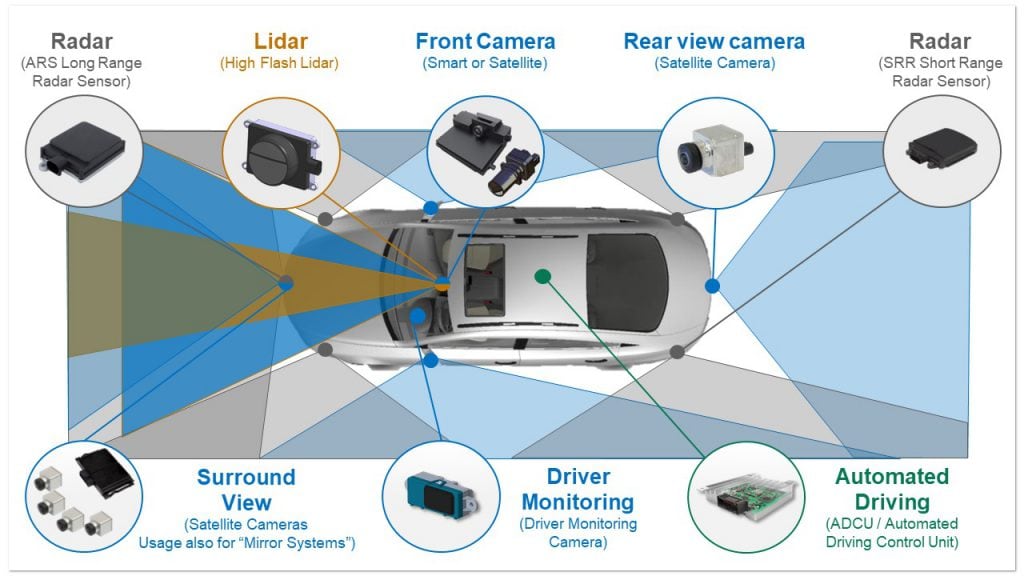
Based On System Based On Component By vehicle type By Region
Adaptive Cruise Control (ACC) Camera Unit Passenger Car North America
Adaptive Front Light (AFL) LiDAR Light Commercial Vehicle Europe
Automatic Emergency Braking (AEB) Radar Sensor Truck South America
Blind Spot Detection (BSD) Ultrasonic Sensor Bus MEA
Cross Traffic Alert (CTA) Infrared Sensor Battery Electric Vehicles (BEV) Asia Pacific
Driver Monitoring System (DMS) Hybrid Electric Vehicles (HEV) Rest Of World
Forward Collision Warning (FCW) Plug-in Hybrid Electric Vehicle (PHEV)
Intelligent Park Assist (IPA) Fuel Cell Electric Vehicle (FCEV)
Lane Departure Warning (LDW)
Night Vision System (NVS)
Pedestrian Detection System (PDS)
Road Sign Recognition (RSR)
Tire Pressure Monitoring System (TPMS)
Traffic Jam Assist (TJA)
Head-up display

Companies Covered in Report:

Aisin Seiki Co. Ltd. Mobileye N.V. (Intel Corporation)
Aptiv PLC NVIDIA Corporation
Autoliv Inc. NXP Semiconductors N.V.
AVL GmbH Osram Licht AG
Continental AG Panasonic Corporation
Delphi Automotive LLP Renesas Electronics Corporation
DENSO Corporation Robert Bosch
Gentex Corporation Siemens AG
Harman International STMicroelectronics N.V.
Hella GmbH & Co. KGaA Tesla Inc.
Hitachi Ltd. Texas Instruments Inc.
Hyundai Mobis Co. Ltd. TRW Automotive (ZF Group)
Infineon Technologies AG Valeo SA
Jayson Electronics Veoneer Inc.
Lear Corporation Volkswagen Group
Magna International Inc. ZF Friedrichshafen AG


After Sales Support

  • Every updated edition of the report and full data stack will be provided at no extra cost for 24 months.
  • Latest 2022 base year report.
  • Free Updated edition of 2023 every quarter without any hidden cost.
  • No user limitation for the report. Unlimited access within the organization.
  • Unrestricted post-sales support at no additional cost
  • Free report customization (equivalent up to 10 analyst’s working days) with purchase. Addition or alteration to country, regional & segment scope
  • Global Industry Reports will support your post-purchase for a period of 24 months to answer any of your queries related to the following market and to provide you any more data needed, for your analysis.
  • Option to purchase regional or some selected Chapters from the report.

Key questions that are answered in this report

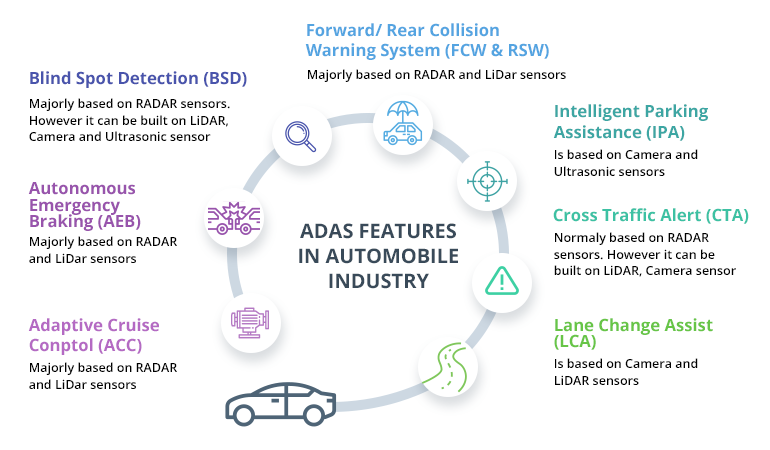
  • What are some of the most promising, high-growth opportunities for the automotive ADAS market by product (AEBS, FCW, ACC, BSD, LDW, PAS, PDS, TSR, NV, DDD), by technology (radar, camera, sensor fusion, LIDAR, infrared, ultrasonic), vehicle type (large car, SUV and crossover, mid-size car, and others), and end user (OEM and aftermarket) ?
  • Which segments will grow at a faster pace and why?
  • What are the key factors affecting market dynamics? What are the key challenges and business risks in this automotive ADAS market?
  • What are the business risks and competitive threats in this automotive ADAS market?
  • What are the emerging trends in this automotive ADAS market and the reasons behind them?
  • What are some of the changing demands of customers in the automotive ADAS market?
  • What are the new developments in the automotive ADAS market? Which companies are leading these developments?

1.1    Industry Outlook
1.1.1    Overview
1.1.1.1    ADAS Overview
1.1.1.2    Autonomous Driving Overview
1.2    Current Laws and Regulatory Bodies Related to Autonomous Vehicles by Country
1.2.1    Current Laws and Regulatory Bodies Related to Testing or Experimentation of Autonomous Vehicles by Country
1.2.2    Regulatory Agencies for Driverless Vehicle
1.3    Supply Chain Analysis
1.3.1    Supply Chain Analysis: Camera
1.3.2    Supply Chain Analysis: Radar
1.3.3    Supply Chain Analysis: Ultrasonic Sensors
1.3.4    Supply Chain Analysis: LiDAR
1.3.5    Supply Chain Analysis: ECU
1.4    Business Dynamics
1.4.1    Market Drivers
1.4.1.1    Increasing Technological Developments and Advancements in ADAS Systems
1.4.1.2    Rising Developments in Connected Infrastructure and Intelligent Transportation System
1.4.1.3    Demand for ADAS Features in Commercial Vehicles
1.4.1.4    Growing Concerns and Measures Over Road Safety
1.4.2    Market Restraints
1.4.2.1    Reliability Issues and Rising Cyber Threats in Autonomous Vehicle
1.4.2.2    High Cost Associated with LiDARs
1.4.2.3    Lack of Government Rules and Regulations in Developing Regions
1.4.2.4    Impact of Coronavirus Disease (COVID-19) on ADAS and Autonomous Driving Component Market
1.4.3    Business Strategies
1.4.3.1    Product Development
1.4.3.2    Business Expansion
1.4.4    Corporate Strategies
1.4.4.1    Mergers and Acquisitions
1.4.5    Key Developments by Automotive OEMs, Autonomous Technology Providers, and Software Providers in Autonomous Driving Industry
1.4.6    Market Opportunities
1.4.6.1    Impact of 5G Technology Enhancing Autonomous Driving Components
1.4.6.2    Increasing Adoption of Autonomous Vehicles in Shared Mobility
1.4.6.3    Rising Focus Toward Vehicle Platooning

2.1    ADAS and Autonomous Driving Component Market (by Application)
2.1.1    ADAS and Autonomous Driving Component Market (by Level of Autonomy)
2.1.1.1    Level 1 (Advance Driving Assist System – ADAS)
2.1.1.2    Level 2 (Partial Automation)
2.1.1.3    Level 3 (Conditional Automation)
2.1.1.4    Level 4 (High Automation)
2.1.1.5    Level 5 (Full Automation)
2.1.2    Global ADAS and Autonomous Driving Component Market (by Vehicle Type)
2.1.2.1    Passenger Vehicle
2.1.2.2    Light Commercial Vehicle
2.1.2.3    Heavy Trucks
2.1.2.4    Heavy Buses
2.2    Demand Analysis for ADAS and Autonomous Driving Component Market (by Application), 2019-2030
2.2.1    Demand Analysis for ADAS and Autonomous Driving Component Market (by Level of Autonomy), 2019-2030
2.2.1.1    Level 1 Autonomy
2.2.1.2    Level 2 Autonomy
2.2.1.3    Level 3 Autonomy
2.2.1.4    Level 4 Autonomy
2.2.1.5    Level 5 Autonomy
2.2.2    Demand Analysis for ADAS and Autonomous Driving Component Market (by Vehicle Type)
2.2.2.1    Passenger Vehicles
2.2.2.2    Light Commercial Vehicles
2.2.2.3    Heavy Trucks
2.2.2.4    Heavy Buses

3.1    Global ADAS and Autonomous Driving Component Market (by Component)
3.1.1    Camera
3.1.1.1    Camera Market (by Function)
3.1.1.1.1    Front-View Camera
3.1.1.1.2    Rear-View Camera
3.1.1.1.3    Side-View Camera
3.1.1.1.4    In-Vehicle Camera
3.1.1.2    Camera Market by Type
3.1.1.2.1    Monocular Camera
3.1.1.2.2    Stereo-Vision Camera
3.1.2    Radar
3.1.2.1    Global ADAS and Autonomous Driving Radar Market (by Type)
3.1.2.1.1    Ultra-Short-Range Radar
3.1.2.1.2    Short-Range Radar
3.1.2.1.3    Medium-Range Radar
3.1.2.1.4    Long-Range Radar
3.1.3    Light Detection and Ranging
3.1.3.1    LiDAR Market (by Type)
3.1.3.1.1    Mechanical LiDAR
3.1.3.1.2    Solid-State LiDAR
3.1.4    Electronic Control Unit
3.1.4.1    ECU Market (by Capacity)
3.1.4.1.1    16-bit ECU
3.1.4.1.2    32-bit ECU
3.1.4.1.3    64-bit ECU
3.1.5    Ultrasonic Sensor
3.2    Demand Analysis for ADAS and Autonomous Driving Component Market (by Component Type)
3.2.1    Camera
3.2.2    Radar
3.2.3    LiDAR
3.2.4    Electronic Control Unit
3.2.5    Ultrasonic Sensor
3.3    Pricing Analysis
3.3.1    Introduction
3.3.2    Camera
3.3.3    Radar
3.3.4    LiDAR
3.3.5    Ultrasonic Sensor
3.3.6    ECU
3.4    Patent Analysis
3.4.1    Introduction
3.4.2    Patent Landscape
3.4.2.1    Patent Landscape: ADAS and Autonomous Driving Radar
3.4.2.2    Patent Landscape: ADAS and Autonomous Driving Camera
3.4.2.3    Patent Landscape: ADAS and Autonomous Driving LiDAR
3.4.2.4    Patent Landscape: ADAS and Autonomous Driving ECU
3.4.2.5    Patent Landscape: ADAS and Autonomous Driving Ultrasonic Sensor

4.1    North America
4.1.1    Market
4.1.1.1    Key Manufacturers and Suppliers in North America
4.1.1.2    Business Challenges
4.1.1.3    Business Drivers
4.1.2    Application
4.1.2.1    North America ADAS and Autonomous Driving Component Market Demand (by Application), Volume and Value Data
4.1.2.2    North America ADAS and Autonomous Driving Component Market Demand (Level of Autonomy by Vehicle Type), Volume and Value Data
4.1.3    Product
4.1.3.1    North America ADAS and Autonomous Driving Component Market Demand (by Component Type), Volume Data
4.1.4    North America (by Country)
4.1.4.1    U.S.
4.1.4.1.1    Market
4.1.4.1.1.1    Buyers Attributes
4.1.4.1.1.2    Key Manufactures and Suppliers in the U.S.
4.1.4.1.1.3    Business Challenges
4.1.4.1.1.4    Business Drivers
4.1.4.1.2    Application
4.1.4.1.2.1    U.S. ADAS and Autonomous Driving Component Market Demand (by Application), Volume and Value Data
4.1.4.1.3    Product
4.1.4.1.3.1    U.S. ADAS and Autonomous Driving Component Market (by Component Type), Volume Data
4.1.4.2    Canada
4.1.4.2.1    Market
4.1.4.2.1.1    Buyers Attributes
4.1.4.2.1.2    Key Manufactures and Suppliers in Canada
4.1.4.2.1.3    Business Challenges
4.1.4.2.1.4    Business Drivers
4.1.4.2.2    Application
4.1.4.2.2.1    Canada ADAS and Autonomous Driving Component Market Demand (by Application), Volume and Value Data
4.1.4.2.3    Product
4.1.4.2.3.1    Canada ADAS and Autonomous Driving Component Market (by Component Type), Volume Data
4.1.4.3    Mexico
4.1.4.3.1    Market
4.1.4.3.1.1    Buyer Attributes
4.1.4.3.1.2    Key Manufacturers and Suppliers in Mexico
4.1.4.3.1.3    Business Challenges
4.1.4.3.1.4    Business Drivers
4.1.4.3.2    Application
4.1.4.3.2.1    Mexico ADAS and Autonomous Driving Component Market Demand (by Application), Volume and Value Data
4.1.4.3.3    Product
4.1.4.3.3.1    Mexico ADAS and Autonomous Driving Component Market (by Component Type), Volume Data
4.2    Europe
4.2.1    Market
4.2.1.1    Key Manufacturers and Suppliers in Europe
4.2.1.2    Business Challenges
4.2.1.3    Business Drivers
4.2.2    Application
4.2.2.1    Europe ADAS and Autonomous Driving Component Market Demand (by Application), Volume and Value Data
4.2.2.2    Europe ADAS and Autonomous Driving Component Market Demand (Level of Autonomy by Vehicle Type), Volume and Value Data
4.2.3    Product
4.2.3.1    Europe ADAS and Autonomous Driving Component Market Demand (by Component Type), Volume Data
4.2.4    Europe (by Country)
4.2.4.1    Germany
4.2.4.1.1    Market
4.2.4.1.1.1    Buyers Attributes
4.2.4.1.1.2    Key Manufactures and Suppliers in Germany
4.2.4.1.1.3    Business Challenges
4.2.4.1.1.4    Business Drivers
4.2.4.1.2    Application
4.2.4.1.2.1    Germany ADAS and Autonomous Driving Component Market Demand (by Application), Volume and Value Data
4.2.4.1.3    Product
4.2.4.1.3.1    Germany ADAS and Autonomous Driving Component Market (by Component Type), Volume and Value Data
4.2.4.2    Netherlands
4.2.4.2.1    Market
4.2.4.2.1.1    Buyers Attributes
4.2.4.2.1.2    Key Manufactures and Suppliers in the Netherlands
4.2.4.2.1.3    Business Challenges
4.2.4.2.1.4    Business Drivers
4.2.4.2.2    Application
4.2.4.2.2.1    Netherlands ADAS and Autonomous Driving Component Market Demand (by Application), Volume and Value Data
4.2.4.2.3    Product
4.2.4.2.3.1    Netherlands ADAS and Autonomous Driving Component Market (by Component Type), Volume Data
4.2.4.3    Rest-of-Europe
4.2.4.3.1    Application
4.2.4.3.1.1    Rest-of-Europe ADAS and Autonomous Driving Component Market Demand (by Application), Volume and Value Data
4.2.4.3.2    Product
4.2.4.3.2.1    Rest-of-Europe ADAS and Autonomous Driving Component Market (by Component Type), Volume Data
4.3    U.K.
4.3.1    Market
4.3.1.1    Buyers Attributes
4.3.1.2    Key Manufacturers and Suppliers in the U.K.
4.3.1.3    Business Challenges
4.3.1.4    Business Drivers
4.3.2    Application
4.3.2.1    U.K. ADAS and Autonomous Driving Component Market Demand (by Application), Volume and Value Data
4.3.2.2    U.K. ADAS and Autonomous Driving Component Market Demand (Level of Autonomy by Vehicle Type), Volume and Value Data
4.3.3    Product
4.3.3.1    U.K. ADAS and Autonomous Driving Component Market Demand (by Component Type), Volume Data
4.4    Asia-Pacific and Japan (APJ)
4.4.1    Market
4.4.1.1    Key Manufacturers and Suppliers in Asia-Pacific and Japan
4.4.1.2    Business Challenges
4.4.1.3    Business Drivers
4.4.2    Application
4.4.2.1    APJ ADAS and Autonomous Driving Component Market Demand (by Application), Volume and Value Data
4.4.2.2    APJ ADAS and Autonomous Driving Component Market Demand (Level of Autonomy by Vehicle Type), Volume and Value Data
4.4.3    Product
4.4.3.1    APJ ADAS and Autonomous Driving Component Market Demand (by Component Type), Volume Data
4.4.4    Asia-Pacific and Japan (by Country)
4.4.4.1    Japan
4.4.4.1.1    Market
4.4.4.1.1.1    Buyers Attributes
4.4.4.1.1.2    Key Manufactures and Suppliers in Japan
4.4.4.1.1.3    Business Challenges
4.4.4.1.1.4    Business Drivers
4.4.4.1.2    Application
4.4.4.1.2.1    Japan ADAS and Autonomous Driving Component Market Demand (by Application), Volume and Value Data
4.4.4.1.3    Product
4.4.4.1.3.1    Japan ADAS and Autonomous Driving Component Market (by Component Type), Volume Data
4.4.4.2    South Korea
4.4.4.2.1    Market
4.4.4.2.1.1    Buyers Attributes
4.4.4.2.1.2    Key Manufactures and Suppliers in South Korea
4.4.4.2.1.3    Business Challenges
4.4.4.2.1.4    Business Drivers
4.4.4.2.2    Application
4.4.4.2.2.1    South Korea ADAS and Autonomous Driving Component Market Demand (by Application), Volume and Value Data
4.4.4.2.3    Product
4.4.4.2.3.1    South Korea ADAS and Autonomous Driving Component Market (by Component Type), Volume Data
4.4.4.3    Rest-of-Asia-Pacific and Japan
4.4.4.3.1    Market
4.4.4.3.1.1    Buyers Attributes
4.4.4.3.1.2    Key Manufactures and Suppliers in Rest-of-Asia-Pacific and Japan
4.4.4.3.1.3    Business Challenges
4.4.4.3.1.4    Business Drivers
4.4.4.3.2    Application
4.4.4.3.2.1    Rest-of-APJ ADAS and Autonomous Driving Component Market Demand (by Application), Volume and Value Data
4.4.4.3.3    Product
4.4.4.3.3.1    Rest-of-APJ ADAS and Autonomous Driving Component Market (by Component Type), Volume Data
4.5    China
4.5.1    Market
4.5.1.1    Buyers Attributes
4.5.1.2    Key Manufacturers and Suppliers in China
4.5.1.3    Business Challenges
4.5.1.4    Business Drivers
4.5.2    Application
4.5.2.1    China ADAS and Autonomous Driving Component Market Demand (by Application), Volume and Value Data
4.5.2.2    China ADAS and Autonomous Driving Component Market Demand (Level of Autonomy by Vehicle Type), Volume and Value Data
4.5.3    Product
4.5.3.1    China ADAS and Autonomous Driving Component Market Demand (by Component Type), Volume Data
4.6    South America
4.6.1    Market
4.6.1.1    Buyers Attributes
4.6.1.2    Key Manufacturers and Suppliers in South America
4.6.1.3    Business Challenges
4.6.1.4    Business Drivers
4.6.2    Application
4.6.2.1    South America ADAS and Autonomous Driving Component Market Demand (by Application), Volume and Value Data
4.6.2.2    South America ADAS and Autonomous Driving Component Market Demand (Level of Autonomy by Vehicle Type), Volume and Value Data
4.6.3    Product
4.6.3.1    South America ADAS and Autonomous Driving Component Market Demand (by Component Type), Volume Data
4.7    Middle East and Africa
4.7.1    Market
4.7.1.1    Buyers Attributes
4.7.1.2    Key Manufacturers and Suppliers in Middle East and Africa
4.7.1.3    Business Challenges
4.7.1.4    Business Drivers
4.7.2    Application
4.7.2.1    MEA ADAS and Autonomous Driving Component Market Demand (by Application), Volume and Value Data
4.7.2.2    MEA ADAS and Autonomous Driving Component Market Demand (Level of Autonomy by Vehicle Type), Volume and Value Data
4.7.3    Product
4.7.3.1    MEA ADAS and Autonomous Driving Component Market Demand (by Component Type), Volume Data

5.1    Competitive Benchmarking
5.2    Company Profiles
5.2.1    Analog Devices, Inc.
5.2.1.1    Company Overview
5.2.1.1.1    Product Portfolio
5.2.1.2    Business Strategies
5.2.1.2.1    Market Development
5.2.1.3    Competitive Position
5.2.1.3.1    Strengths of the Company
5.2.1.3.2    Weaknesses of the Company
5.2.2    Aptiv
5.2.2.1    Company Overview
5.2.2.1.1    Product Portfolio
5.2.2.2    Corporate Strategies
5.2.2.2.1    Partnerships and Collaborations
5.2.2.3    Competitive Position
5.2.2.3.1    Strengths of the Company
5.2.2.3.2    Weakness of the Company
5.2.3    Continental AG
5.2.3.1    Company Overview
5.2.3.1.1    Product Portfolio
5.2.3.2    Corporate Strategies
5.2.3.2.1    Partnerships and Collaborations
5.2.3.3    Competitive Position
5.2.3.3.1    Strengths of the Company
5.2.3.3.2    Weakness of the Company
5.2.4    Robert Bosch GmbH
5.2.4.1    Company Overview
5.2.4.1.1    Product Portfolio
5.2.4.2    Competitive Position
5.2.4.2.1    Strengths of the Company
5.2.4.2.2    Weaknesses of the Company
5.2.5    ZF Friedrichshafen AG
5.2.5.1    Company Overview
5.2.5.1.1    Product Portfolio
5.2.5.2    Corporate Strategies
5.2.5.2.1    Partnerships and Collaborations
5.2.5.3    Competitive Position
5.2.5.3.1    Strengths of the Company
5.2.5.3.2    Weaknesses of the Company
5.2.6    Valeo
5.2.6.1    Company Overview
5.2.6.1.1    Product Portfolio
5.2.6.2    Corporate Strategies
5.2.6.2.1    Partnerships and Collaborations
5.2.6.3    Competitive Position
5.2.6.3.1    Strengths of the Company
5.2.6.3.2    Weakness of the Company
5.2.7    Texas Instruments Incorporated
5.2.7.1    Company Overview
5.2.7.1.1    Product Portfolio
5.2.7.2    Competitive Position
5.2.7.2.1    Strengths of the Company
5.2.7.2.2    Weaknesses of the Company
5.2.8    Denso Corporation
5.2.8.1    Company Overview
5.2.8.1.1    Product Portfolio
5.2.8.2    Competitive Position
5.2.8.2.1    Strengths of the Company
5.2.8.2.2    Weaknesses of the Company
5.2.9    Infineon Technologies
5.2.9.1    Company Overview
5.2.9.1.1    Product Portfolio
5.2.9.2    Competitive Position
5.2.9.2.1    Strengths of the Company
5.2.9.2.2    Weaknesses of the Company
5.2.10    Intel Corporation
5.2.10.1    Company Overview
5.2.10.1.1    Product Portfolio
5.2.10.2    Competitive Position
5.2.10.2.1    Strengths of the Company
5.2.10.2.2    Weaknesses of the Company
5.2.11    LeddarTech Inc.
5.2.11.1    Company Overview
5.2.11.1.1    Product Portfolio
5.2.11.2    Corporate Strategies
5.2.11.2.1    Partnerships and Collaborations
5.2.11.3    Competitive Position
5.2.11.3.1    Strengths of the Company
5.2.11.3.2    Weaknesses of the Company
5.2.12    Magna International Inc.
5.2.12.1    Company Overview
5.2.12.1.1    Product Portfolio
5.2.12.2    Competitive Position
5.2.12.2.1    Strengths of the Company
5.2.12.2.2    Weaknesses of the Company
5.2.13    Quanergy Systems Inc.
5.2.13.1    Company Overview
5.2.13.1.1    Product Portfolio
5.2.13.2    Corporate Strategies
5.2.13.2.1    Partnerships and Collaborations
5.2.13.3    Competitive Position
5.2.13.3.1    Strengths of the Company
5.2.13.3.2    Weakness of the Company
5.2.14    Autoliv Inc.
5.2.14.1    Company Overview
5.2.14.1.1    Product Portfolio
5.2.14.3    Competitive Position
5.2.14.3.1    Strengths of the Company
5.2.14.3.2    Weaknesses of the Company
5.2.15    Velodyne LiDAR, Inc.
5.2.15.1    Company Overview
5.2.15.1.1    Product Portfolio
5.2.15.2    Corporate Strategies
5.2.15.2.1    Partnerships and Collaborations
5.2.15.3    Competitive Position
5.2.15.3.1    Strengths of the Company
5.2.15.3.2    Weaknesses of the Company

—————  Other 135 Market Players  ————-

Methodology

Research Methodology is the process used to collect information and data for the purpose of making business decisions. The success of a research project is entirely dependent on the research methodology adopted by the company. Research Methodology and Scope We have implemented a mix of primary and secondary research for our market estimate and forecast. Secondary research formed the initial phase of our study, where we conducted extensive data mining, referring to verified data sources such as independent studies, company annual reports, white papers, case studies, government and regulatory published articles, technical journals, magazines, and paid data sources. It was also used to obtain important information about the key players and market classification & segmentation according to industry trends to the bottom-most level, and key developments related to market and technology perspectives. A database of the key industry leaders was also prepared using secondary research.

In the primary research process, various primary sources from both supply and demand sides have been interviewed to obtain qualitative and quantitative information important for respective regions. The primary sources from the supply side included industry experts such as CEOs, VPs, marketing directors, technology and innovation directors, and related executives from key companies and organizations operating in the respective regions. The primary data has been collected through questionnaires, e-mails, and telephonic interviews, end-user surveys, consumer surveys, technology distributors and wholesaler’s surveys.

  • Quantitative methods (e.g. surveys) are best for measuring, ranking, categorizing, identifying patterns and making generalizations
  • Qualitative methods (e.g. interviews) are best for describing, interpreting, contextualizing, and gaining in-depth insight into specific concepts or phenomena
  • Mixed methods allow for a combination of numerical measurement and in-depth exploration.

Market drivers and restraints, along with their current and expected impacts, technological scenario and expected developments, end-use industry trends and dynamics  and consumer behavior trends  these forecasting parameters were considered.

Ethical approach, attention to detail, consistency, latest trend in the market and highly authentic source these are benefits of company’s research methodology.

Global Industry Reports

Market size estimation methodology top-down and bottom-up approaches

Both top-down and bottom-up approaches have been used to estimate and validate the total size of the virtual reality market. These methods have also been extensively used to estimate the sizes of various market subsegments. Estimating the size of the market in each region by adding the sizes of country-wise markets and tracking the ongoing and upcoming implementation of virtual reality projects by various companies in each region and forecasting the size of the virtual reality market based on these developments and other critical parameters, including COVID-19 related impacts

Data Triangulation

After arriving at the overall market size—using the market size estimation processes explained above—the market has been split into several segments and subsegments. To complete the overall market engineering process and arrive at the exact statistics of each market segment and subsegment, data triangulation, and market breakdown procedures have been employed, wherever applicable. The data has been triangulated by studying various factors and trends from both the demand and supply sides. It provide detailed information regarding the major factors (drivers, restraints, opportunities, challenges, company profiles, key player strategies competitive developments and key developments) influencing the virtual reality market growth.

Statistical Model

Our market estimates and forecasts are derived through simulation models. A unique model is created customized for each study. Gathered information for market dynamics, technology landscape, application development and pricing trends is fed into the model and analyzed simultaneously. These factors are studied on a comparative basis, and their impact over the forecast period is quantified with the help of correlation, regression and time series analysis.